下载:
下载:


-
不同植物的适应性存在差异,广布种生态幅宽,对外界环境变异的耐受性较强;狭域种由于其分布的范围较小,生态幅较窄,对外界环境变异的耐受性较弱[1]。有研究表明,气候是影响物种分布范围大小的主要因素[2],地形因子[3]、土壤因子[4-5]、太阳辐射[6]等环境因子也是影响物种丰富度格局的重要因素。温度和降水对物种的分布具有主要的影响,多个植物类群的分布受温度阈值和降水阈值的影响[6-8]。土壤在气候、生物、地形等因素的长期作用下,陆地表层由母岩风化形成的一个能够生长植物的疏松多孔物质层,能影响植物地下部分的物质、能量交换和酸碱平衡以及种子的萌发,进而影响植物的分布[3, 9, 10]。近年来,有研究发现特殊的土壤基质可能也是物种狭域分布的重要因素[11],如石灰岩生境使海南凤仙花(Impatiens hainanensis )狭域分布在海南岛石灰岩地区[12-13]。因此,植物的分布范围可能与气候、土壤等环境因子及其阈值范围有关。
无根藤属(Cassytha)是樟科唯一一类藤本植物,具有寄生缠绕的特性。全球无根藤属有20多种[14-15],产于热带地区,大多数种狭域分布于澳大利亚的热带亚热带地区,少数物种局限分布在非洲、日本和东南亚的某些地区,只有无根藤(C. filiformis)一种为广布种,广泛分布在大洋洲、非洲、美洲和亚洲的热带亚热带地区[14],常见于沿海的低矮植被上,但也出现在林地及湖泊沙滩等地区[16]。无根藤分布范围的海拔通常不超过600 m[17],但也见于长江以南、海拔1 600 m以下的山坡灌丛和森林中,包括沿海和内陆[18]。研究发现,无根藤对沿海分布区的农田、果园及森林树木造成了严重危害[19]。无根藤属部分物种的种子属于顽拗型,具有物理休眠的特性,是樟科类群中唯一已知的可以休眠的植物[20],休眠期可达10年,成熟干燥的种子散落在表层土壤形成种子库。无根藤种子有坚硬的种皮、抗逆性强[21],不易被海水侵蚀,适宜长距离扩散[22]。
物种分布模型使用地理信息系统(GIS)或遥感等空间数据,结合气候、土壤、地形等环境因素,来推断物种在给定地理区域的分布概率,可以用来模拟物种现有的潜在适生区,并预测未来气候变化下的潜在分布格局。MaxEnt(最大熵)是其中一种常用的分布模型,基于最大熵原理,通过最大化信息熵来估计物种分布的概率分布[23],不仅可以结合环境因子处理小样本数据,而且适用于不同类型和不同地区的物种分布建模[24]。
基于MaxEnt模型,分析了全球范围内无根藤属内各物种的生境适宜性与环境变量之间的关系,同时对适宜生境的空间分布进行了预测,揭示环境因子对无根藤属各物种分布情况的影响,以期探究樟科无根藤属中狭域种与广布种分布格局的差异及其成因。
-
通过在全球生物多样性信息网络GBIF(https://www.gbif.org/)下载全球范围内樟科无根藤属植物带有经纬度坐标信息的数据,将其导入Excel表格中,剔除重复和错误鉴定的分布信息;补充在中国、泰国、老挝、日本和肯尼亚等区域内实地采集物种的地理分布信息,统计所有具有经纬度信息的无根藤属物种的分布数据。为了避免MaxEnt模拟时导致过度拟合而产生结果偏差,将无根藤属各个物种的分布点分别导入ArcGIS 10.7中,并对10 km以内的物种分布坐标只保留其一。在ArcGIS 10.7中将地理坐标转变为投影坐标,并保存为CSV文件格式。最终得到世界范围内无根藤属各物种的分布数据(见表1),除去分布点数据少于5个点的3个物种,共对可进行模拟的21个物种进行了潜在适生区模拟。
表 1 无根藤属潜在适生区模拟的物种分布数据
Table 1. Species distribution data used for simulating potential suitable area of Cassytha
物种名称 分布
数据拟模拟
数据可否
模拟C. filiformis 8683 3997 可 C. aurea 248 153 可 C. candida 228 82 可 C. capillaris 857 466 可 C. ciliolata 476 137 可 C. flava 280 149 可 C. flindersii 138 49 可 C. glabella 18720 2999 可 C. graminicola 7 4 否 C. larsenii 6 2 否 C. melantha 5606 2201 可 C. micrantha 63 37 可 C. muelleri 21 14 可 C. nodifora 128 70 可 C. paniculata 217 87 可 C. pedicellosa 37 16 可 C. peninsularis 875 364 可 C. pergracilis 23 4 否 C. phaeolasia 2163 224 可 C. pomiformis 362 190 可 C. pondoensis 48 30 可 C. pubescens 14649 2960 可 C. racemosa 1053 439 可 C. rufa 63 47 可 -
从世界气候数据网站(https://www.worldclim.org/)获取当前(1970-2000)的气候、太阳辐射、风速因子的数据;从地理空间数据云(http://www.gscloud.cn/sources)获取地形因子数据,选取海拔、坡度和坡向,从世界粮农组织网站上的世界统一土壤数据库Harmonized World Soil Database(http://www.fao.org)获取土壤数据,从GLC 2000(Global Land Cover)土地覆盖分类系统数据库(https://www.osgeo.cn/map/mr11)获取土壤覆盖类型。所有环境因子均采用2.5′的分辨率,用ArcGIS 10.7软件按照研究区域进行剪裁,并将裁剪后的气候数据转换为ASCII格式。为了避免环境因子之间的高相关性而导致模拟结果的过度拟合,影响MaxEnt模型评估环境变量的贡献率[25],利用ArcGIS中的波段集统计的Pearson相关系数对环境变量进行相关性分析,同时将环境因子代入最大熵模型进行建模,运用刀切法(jackknife)和反馈得到的环境因子对所有样品地理潜在适生区分布贡献率大小进行筛选,综合两种方法筛选得到适宜的环境变量(见表2)。
表 2 用于物种分布区预测的环境变量
Table 2. Environmental variables for species distribution prediction
类型 环境变量 变量描述 气候因子 Bio01 年平均气温(℃) Bio03 等温性 Bio04 气温季节性变动系数 Bio06 最冷月份最低温度(℃) Bio08 最湿季度平均温度(℃) Bio09 最干季度平均温度(℃) Bio10 最暖季度平均温度(℃) Bio11 最冷季度平均温度(℃) Bio12 年降水量(mm) Bio14 最干月份降水量(mm) Bio15 降水量季节性变化(mm) Bio18 最暖季度降水量(mm) 太阳辐射 Srad05 5月太阳辐射 (kJ m−2d−1) Srad06 6月太阳辐射(kJ m−2d−1) Srad07 7月太阳辐射(kJ m−2d−1) Srad08 8月太阳辐射(kJ m−2d−1) Srad11 11月太阳辐射(kJ m−2d−1) Srad12 12月太阳辐射(kJ m−2d−1) 风速 wind01 1月风速(m s−1) wind04 4月风速(m s−1) wind05 5月风速(m s−1) wind12 12月风速(m s−1) 土壤因子 t-bs 上层土壤基本饱和度(%) t-ref-bulk 上层土壤容重(kg·dm−3) t-cec 上层土壤电导率(dS·m−1) t-clay 上层土壤粘土含量(%wt) t-ece 上层土壤的阳离子交换能力(cmol·kg−1) t-esp 上层土壤可交换钠盐(%vol) t-gravel 上层土壤碎石体积百分比(%) t-ph 上层土壤酸碱度 t-slit 上层土壤淤泥含量(%) t-teb 上层土壤交换性盐基(cmol·kg−1) t-usda 上层土壤USDA质地分类(1-13) 地形因子 Elevation 海拔(m) Slope 坡度(°) Aspect 坡向 土地覆盖类型 Glc 全球土地植被覆盖类型(1-23) -
物种分布点数据(.CSV格式)和环境变量数据(.ASCII格式)导入MaxEnt v3.4.1软件中进行潜在适生区模拟。将其结果导入ArcGIS 10.7软件后采用平均间隔法(equal interval)将适宜度分为5级,某点的适宜度为该点的逻辑值占整个预测区域内最高逻辑值的百分比,以最高逻辑值的80%~<100%为高度适宜区,60%~<80%为中度适宜区,40%~<60%为一般适宜区,20%~<40%为低度适宜区,0~<20%为不适宜区[26]。
-
MaxEnt采用受试者操作特性曲线(Receiver Operating Characteristic curve, ROC)分析法进行模型精度检验。该曲线以假阳性率(1—特异度)为横坐标,以真阳性率(灵敏度)为纵坐标绘制曲线[27-29]。对AUC进行评估时,不同的值代表不同的重要性级别:一般认为0.5~<0.6为预测失败;0.6~<0.7为预测结果较差;0.7~<0.8为预测结果一般;0.8~<0.9为预测结果良好;0.9~<1.0为预测结果优秀[30-31]。
-
在物种分布模拟中,评估环境变量的重要性是一个重要的步骤,它有助于确定哪些环境因子对物种的分布格局起到关键作用[27, 32]。MaxEnt通常使用综合使用贡献率、置换重要值和刀切法来评估环境变量在限制物种地理分布格局中的重要性。刀切法检验则通过依次使用某一变量或依次排除某一变量来创建一系列新的模型,比较模型间正规化训练增益(regularized training gain)、测试增益(test gain)和AUC值的差异来评估环境变量的重要性[32]。
-
将无根藤属内各物种分布点导入ArcGIS 10.7中绘制了其分布图。澳大利亚及周边地区狭域分布的无根藤属物种主要分布在沿海环岛地带(见图1):C. aurea主要分布于西澳大利亚的西北到西南沿海地区(见图1-a),C. candida主要分布在北奥北部沿海地区(见图1-b),C. flava、C. flindersii、C. Melantha、C. micrantha主要分布于西澳和南澳的沿海地区(见图1-c, d, e, f),C. muelleri主要分布于昆士兰和西南威尔士接壤的沿海地区(见图1-g),C. nodiflora主要分布于西澳沿海热带地区(见图1-h),C. phaeolasia主要分布于新南威尔士和维多利亚的沿海区域(见图1-l),C. pedicellosa只分布于塔斯马尼亚岛(见图1-j),C. glabella主要分布于西澳大利亚西南沿海、南澳大利亚东南沿海、新南威尔士和维多利亚沿海及塔斯马尼亚岛(见图1-p),C. capillaris主要分布于澳大利亚北部地区和东南亚少数地区(见图1-q),C. pubescens主要分布于西澳大利亚与澳大利亚北部地区的沿海地区和新西兰沿海地区(见图1-r)。C. larsenii分布于泰国(见图1-s),C. pergracilis分布于日本(见图1-t)。非洲特有种C. ciliolata主要分布于非洲好望角地区,C. pondoensis主要分布于莫桑比克等南非国家,C. graminicola主要分布于加蓬等国家,三个物种的分布区没有重合区域(见图1-u),只有广布种无根藤分布在全球的热带亚热带地区(见图1-v)。
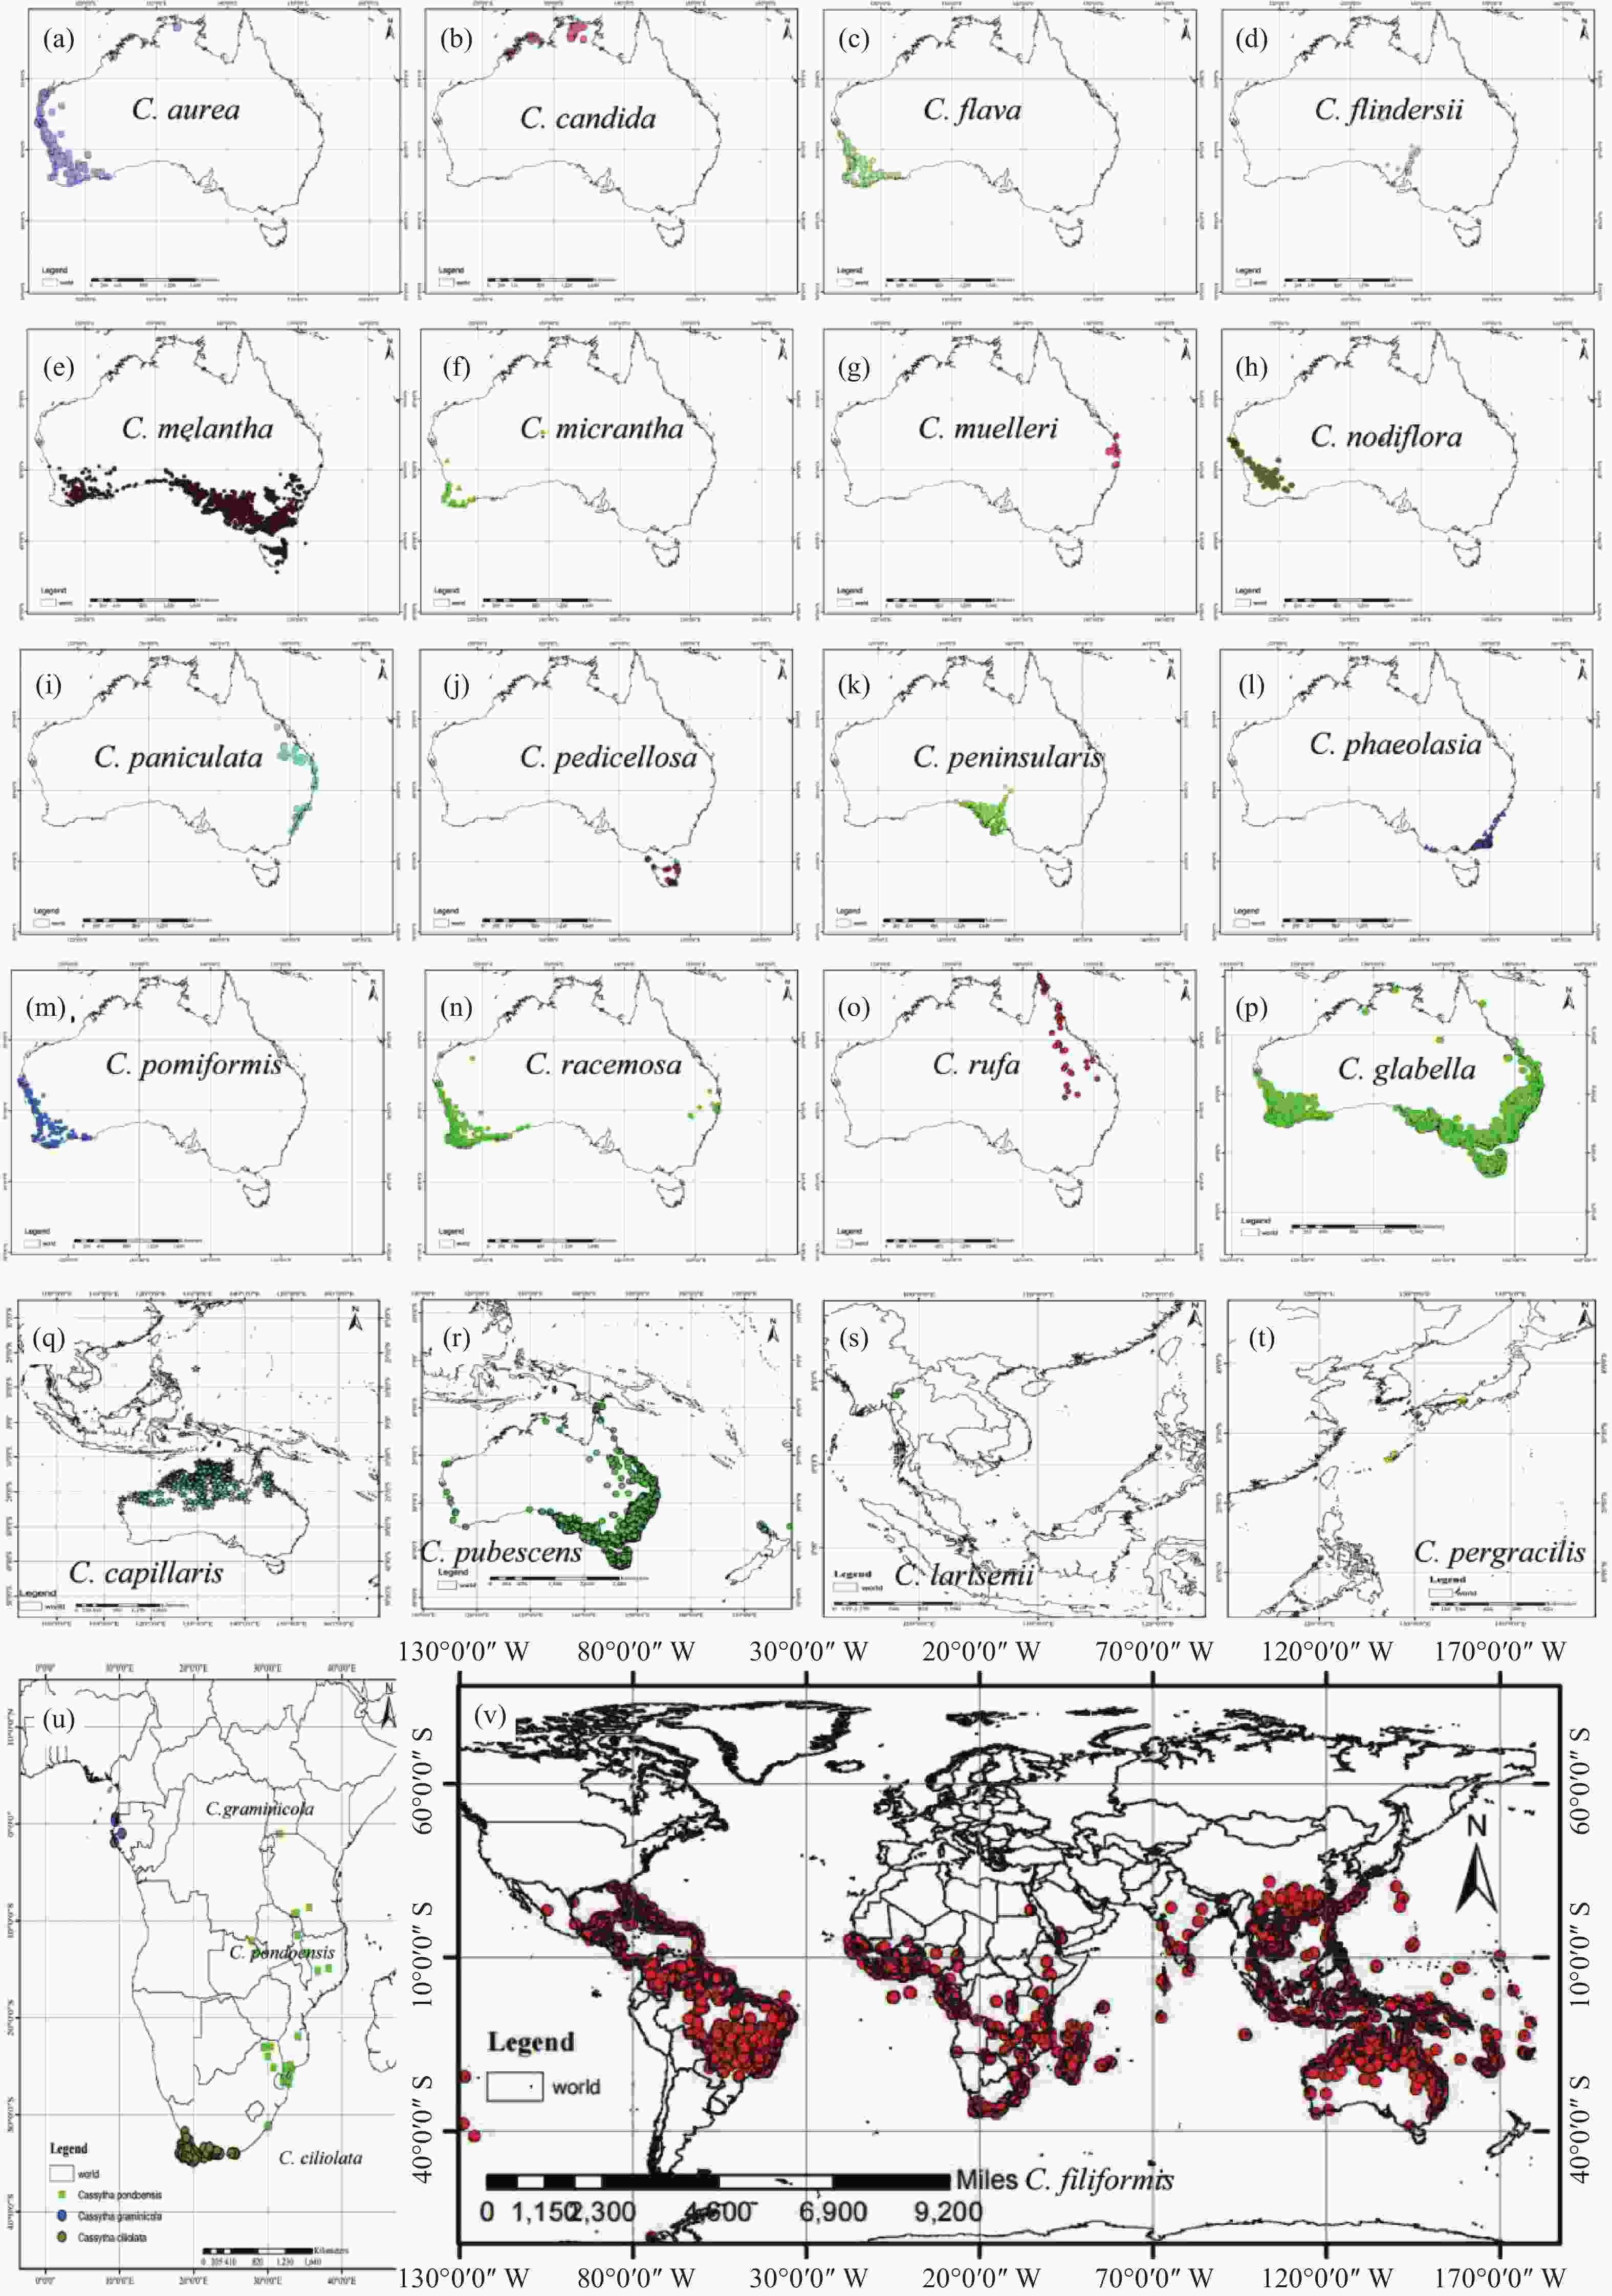
图 1 无根藤属内24个物种的分布范围
Figure 1. Distribution range of the Cassytha spp.
-
AUC值越大说明预测的分布与随机分布相距甚远,选择的环境变量与地理分布之间的相关性很大,相关性越大,则说明预测结果的可靠性更高、预测效果也就更好[4]。均运行10次以上模型,取平均值,得到ROC曲线,其训练AUC平均值皆大于0.9(见表3),稳定性好。依据评价标准,该模型的总体预测精度达到了优秀水平,说明该模型预测无根藤属物种潜在适生分布的结果准确。
表 3 无根藤属21个物种的AUC值统计表
Table 3. Statistical table of AUC values of the Cassytha spp.
模拟物种 AUC 模拟物种 AUC C. aurea 0.987 C. nodiflora 0.996 C. candida 0.996 C. paniculata 0.996 C. capillaris 0.973 C. pedicellosa 0.999 C. ciliolata 0.994 C. peninsularis 0.984 C. filiformis 0.934 C. phaeolasia 0.990 C. flava 0.993 C. pomiformis 0.990 C. flindersii 0.996 C. pondoensis 0.992 C. glabella 0.903 C. pubescens 0.905 C. melantha 0.916 C. racemosa 0.981 C. micrantha 0.995 C. rufa 0.995 C. muelleri 0.999 -
无根藤属21个物种的适生区预测结果如图2所示,狭域种的潜在适生区与现有分布范围基本吻合,但C. aurea(见图2-a)、C. flava(见图2-c)、C. peninsularis(见图2-k)、C. pomiformis(见图2-m)、C.phaeolasia(见图2-l)和C. racemosa(见图2-n)6个分布在澳大利亚南部沿海局部区域的物种在没有分布点的地方却存在小范围高适生区;非洲特有的C. ciliolata(见图2-s)和C. pondoensis(见图2-t)的适生区范围比实际分布范围要广一些,并也预测到澳大利亚的某些地区也可能存在这两个非洲特有种的高适生区。C. pubescens(见图2-r)和C.capillaris(见图2-q)的潜在适生区预测结果显示,中国及东南亚的少数地区存在低适生区,但中、高适生区与分布范围基本吻合;而广布种无根藤的适生区则与其现有的分布范围高度吻合(见图2-u)。
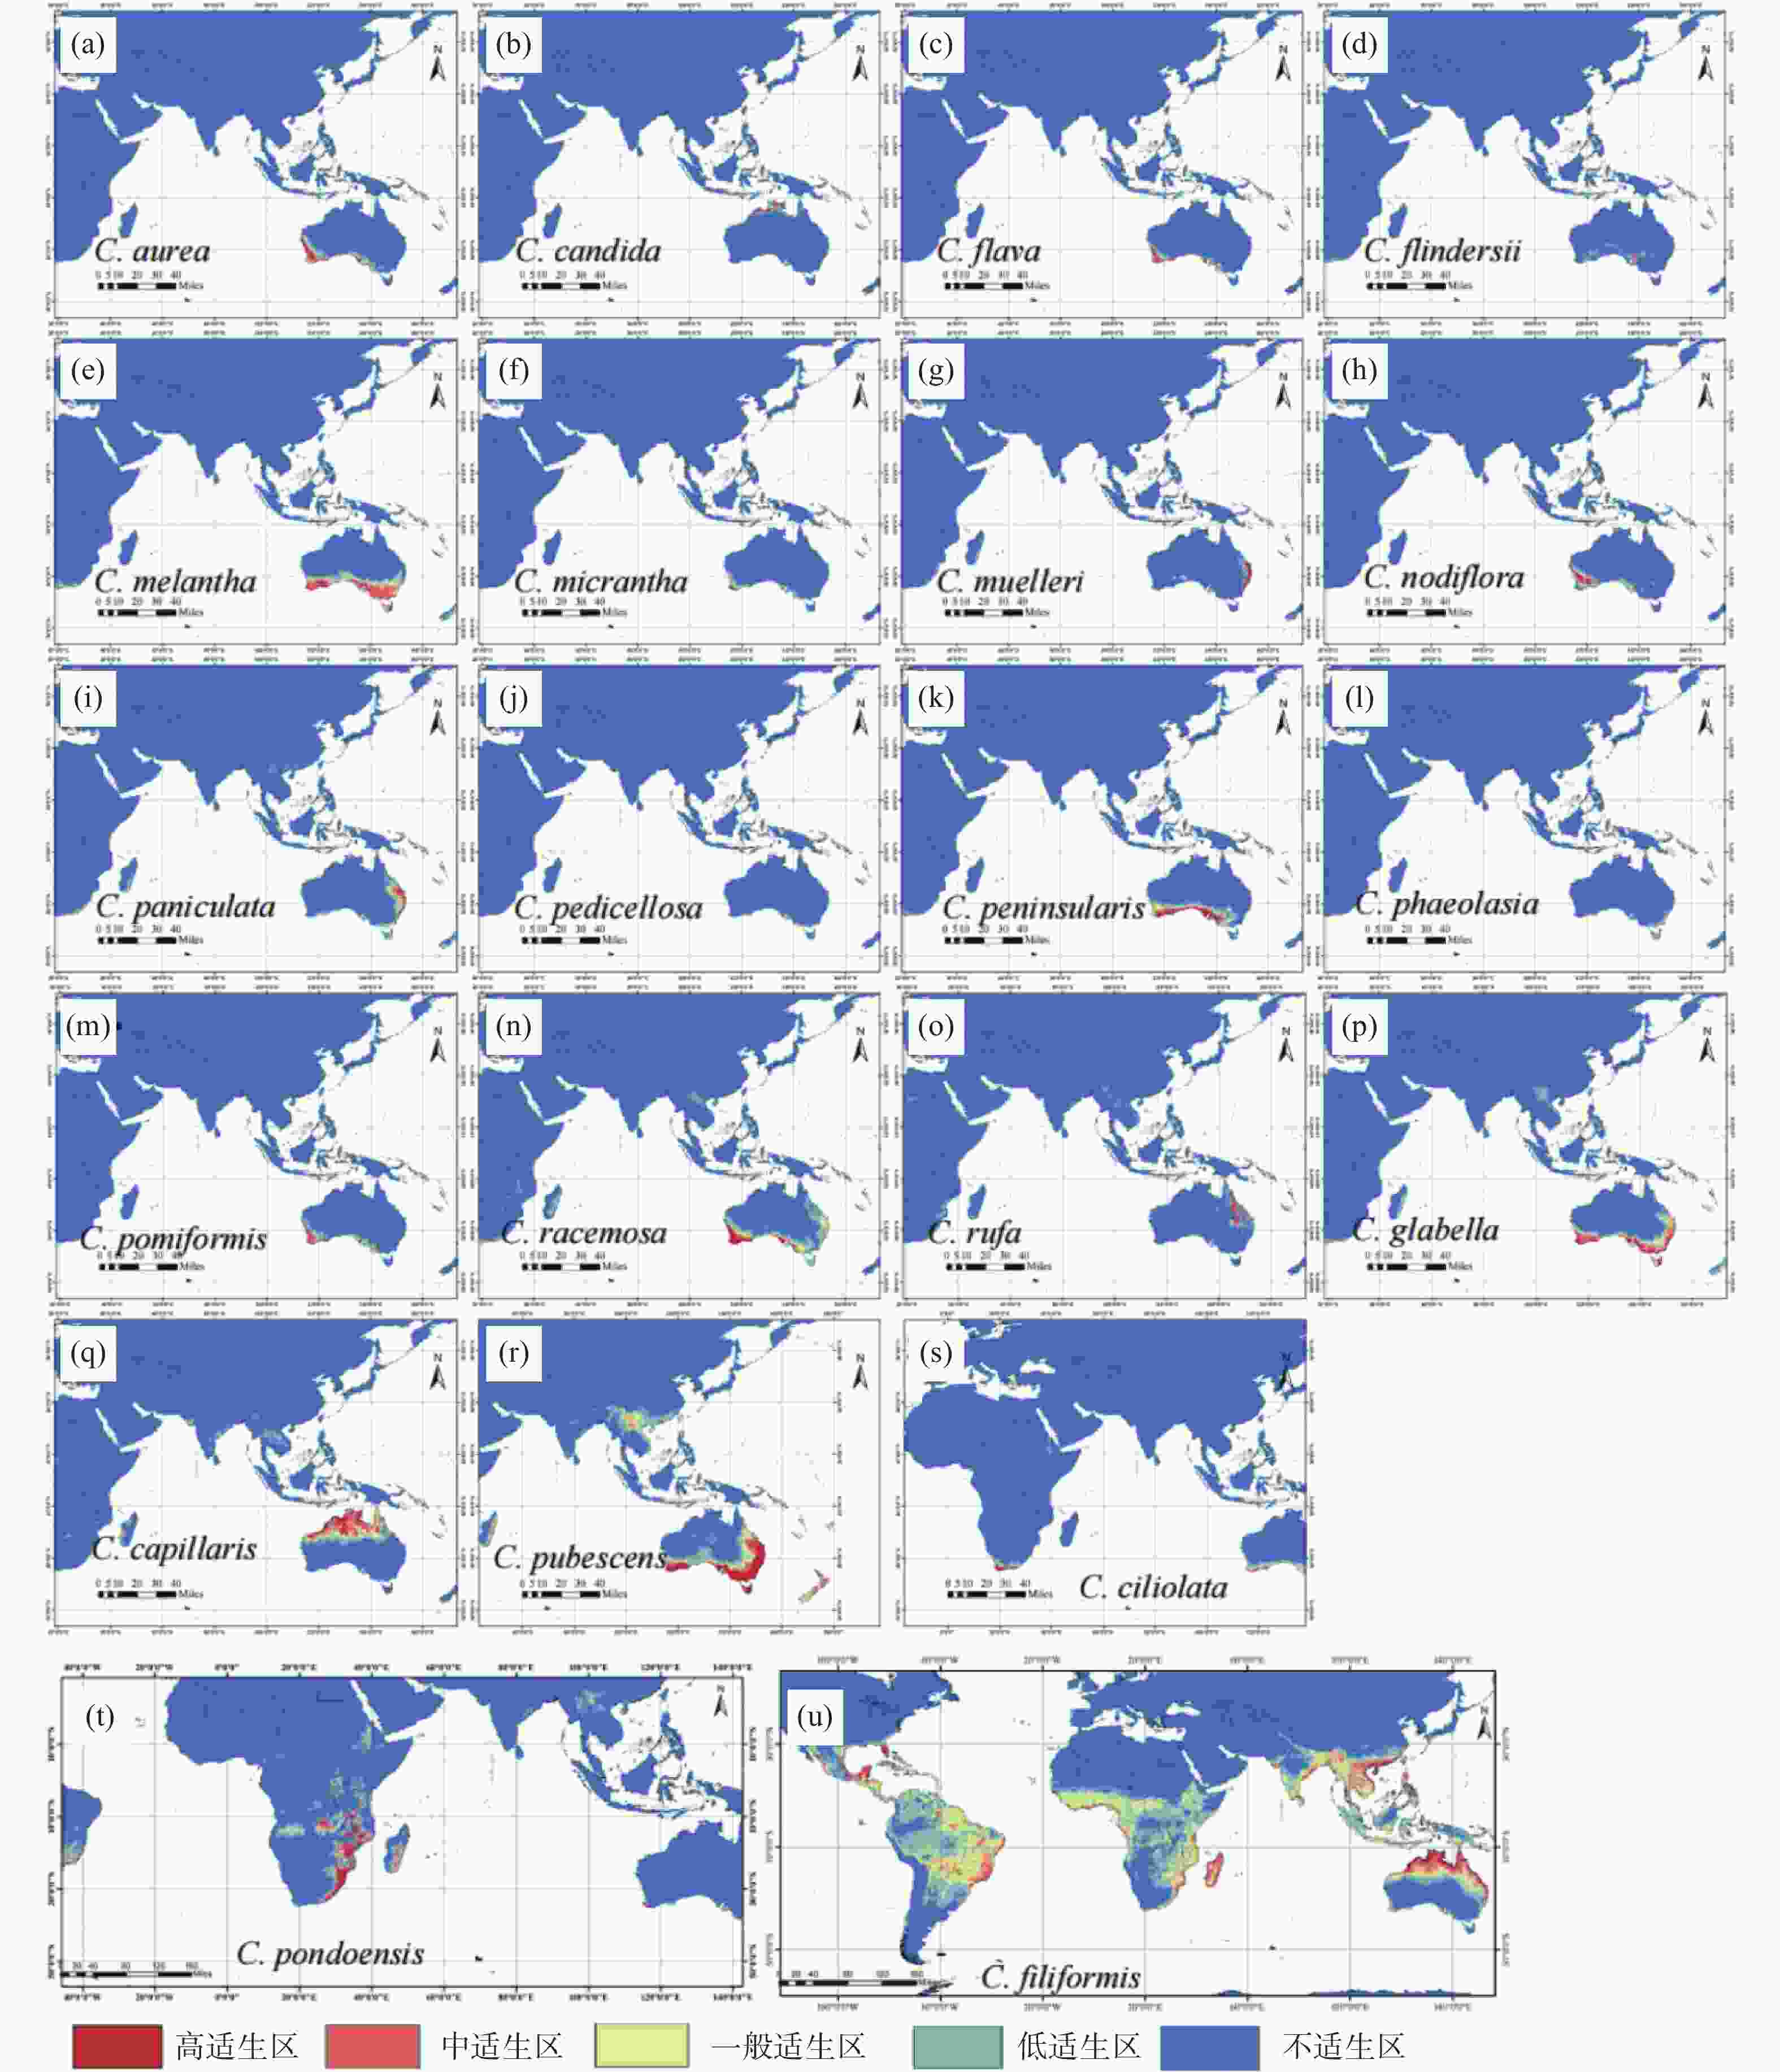
图 2 基于MaxEnt模型模拟的无根藤属物种潜在适生区
Figure 2. Potential suitable distribution area of Cassytha based on MaxEnt model
-
依据MaxEnt模拟得到的环境因子相对贡献分析表明,无根藤属物种分布主要受温度、降水和土壤因子影响,不同物种影响分布的主导环境因子有所不同(见表4)。C. candida、C. micrantha、C. peninsularis和C. phaeolasia的分布主要受到降水因素的影响,其中C. micrantha、C. peninsularis受最暖季度降水量(bio18)因素影响较大,C. candida和C. phaeolasia分别受年降水量(bio12)和降水季节性变化(bio15)主导。C. capillaris、C. paniculata、C. pubescens的分布则受温度和降水因素的共同影响,其中C. capillaris受最暖季节降水量(bio18)、降水季节性变化(bio15)和等温性(bio03)共同主导,C. paniculata、C. pubescens则受最干月份降水量(bio14)和最冷月份最低温(bio06)影响较大。其余无根藤属物种则受温度因子主导,其中C. ciliolata、C. flindersii、C. Melantha、C. nodiflora、C. pondoensis和C. rufa都受等温性(bio03)主导,C. aurea、C. glabella和无根藤受最冷月份最低温(bio06)主导,C. flava、C. pomiformis和C. racemosa则受最湿季度平均温(bio08)影响较大,只有C. muelleri受气温季节性变动系数(bio04)主导。同时分析也发现,土壤因子对无根藤属狭域种潜在适生区模拟的累计贡献都大于9%,只有广布种无根藤的分布几乎不受土壤因子的影响,累计贡献率只有1.1%。另外,太阳辐射、风速等环境因子对无根藤属物种分布的影响都较小。
表 4 主要气候因子对MaxEnt模型预测无根藤属物种分布的贡献率与适宜区间
Table 4. Relative contributions of the main environmental variables to the MaxEnt modelling and suitable ranges
物种名称 气候变量 贡献率/% 置换重要值/% 适宜区间 最适峰值 环境因子类别 总贡献率/% C. aurea bio06 23.3 21.8 4.1-17.3 6.9 温度 35.8 bio18 16 3.4 25.8-69.9 36.8 降水 34.2 bio08 12.5 22.9 8.9-20.7 11.5 土壤 19.7 C. candida bio12 25.6 44.1 1027.4-1602.3 1250.9 降水 57.0 bio14 18 0 0.4-1.5 0.9 土壤 29.3 t-esp 15.8 0.2 2.5-3.3 2.7 温度 7.8 C. capillaris bio18 15.5 7.9 103.0-665.9 268.5 降水 42.9 bio15 13.5 9.1 92.4-124.6 109.6 温度 35.8 bio03 12.4 3.6 40.0-52.4 49.1 土壤 12.0 C. ciliolata bio03 25.8 12.4 38.5-47.3 45.4 温度 40.1 bio04 14.2 44.4 256.7-385.5 272.3 降水 19.2 slope 11 1.3 0.6-6.3 3.7 土壤 9.7 C. filiformis bio06 43.2 18 > 9.4 > 26.6 温度 60.9 bio11 14 39.5 12.1-27.4 24.8 降水 26.7 bio12 13.8 8.5 676.0-6520.9 1299.8 土壤 1.1 C. flava bio08 23.3 53.5 12.1-27.4 13.8 温度 44.4 bio18 14.4 4.7 36.8-47.8 39.8 降水 30.0 bio14 12.9 3 6.9-13.4 9.1 土壤 16.2 C. flindersii bio03 24.1 25.8 37.1-42.4 39.4 温度 32.8 bio14 17.5 17.5 9.1-25.4 17.8 降水 26.4 slope 12.7 4.9 0.5-4.5 1.1 土壤 18.0 C. glabella bio06 35.1 3.2 3.4-11.0 7.9 温度 55.1 bio14 23.9 9.4 15.6-77.7 49.3 降水 23.9 bio04 12 67.5 240.7-471.3 364.0 土壤 14.0 C. melantha bio03 28.3 1.5 35.6-42.1 38.1 温度 47.6 bio17 23.7 2.4 99.4-204.5 157.0 降水 23.7 bio11 12 1.6 3.6-4.2 9.8 土壤 11.2 C. micrantha bio18 24.3 5.7 36.8-47.8 47.8 降水 44.1 bio14 15.8 7.5 8.0-27.6 13.4 土壤 22.5 bio03 13.4 0 35.6-42.2 37.5 温度 19.6 C. muelleri bio04 29.5 67.7 305.0-396.2 353.2 温度 48.4 bio15 13.3 7.4 22.5-42.9 32.7 降水 19.3 bio06 10.2 0 7.9-10.0 8.9 土壤 12.6 C. nodiflora bio03 15.1 0.3 37.3-41.6 39.4 温度 35.2 bio18 14.9 0.5 36.8-58.9 47.8 降水 28.8 t-esp 14 0.2 4.0-10.6 5.4 土壤 22.9 C. paniculata bio14 25.3 1.4 38.5-117.0 70.0 温度 45.9 bio06 24 30 7.8-12.3 9.5 降水 31.0 bio04 18.1 43.6 235.3-417.7 364.0 温度 45.9 C. pedicellosa bio04 23.8 2.7 0-95.8 0.0 温度 41.0 evle 14.2 3.4 0-163.0 0.0 降水 25.4 bio15 13.7 0 0-17.0 0.0 土壤 15.1 C. peninsularis bio18 29.8 16.5 0- 257.5 3.6 降水 51.2 bio06 19.3 3.8 7.1-10.9 8.2 温度 33.4 bio17 17.5 3.2 35.0-48.6 41.7 土壤 10.4 C. phaeolasia bio15 28.8 5.3 8.4-13.9 9.7 降水 47.4 glc 27.6 3.5 1、2、3 1 温度 19.0 bio14 18.6 9.4 54.8-70.7 62.4 土壤 11.7 C. pomiformis bio08 25.9 55.8 10.8-14.3 12.7 温度 49.0 t-slit 14.4 1.7 5.9-14.1 6.5 降水 22.2 C. pomiformis bio06 13.1 32.7 10.8-14.3 9.8 土壤 19.3 C. pondoensis bio03 28.8 1.1 46.6-56.0 50.3 温度 48.2 bio12 14.6 0.9 803.3-1554.4 1266.9 降水 20.2 bio11 13.6 0.7 15.1-20.0 19.1 土壤 13.7 C. pubescens bio14 33.3 12.7 32.0-74.5 53.7 温度 49.6 bio06 18.1 2.8 1.9-9.9 6.2 降水 33.3 bio03 17.9 4.1 34.3-41.1 39.4 土壤 11.5 C. racemosa bio08 21.8 11 10.6-14.7 13.1 温度 52.2 bio03 16.2 10.2 34.3-41.1 38.5 降水 23.3 bio06 14.2 6.1 7.3-11.8 10.3 土壤 15.8 C. rufa bio03 25.3 6.1 38.2-53.3 44.0 温度 30.4 bio18 17.3 26.9 290.7-3050.1 423.1 降水 28.8 t-ece 8.8 7.2 0.1-0.3 0.2 土壤 23.3 根据环境因子响应曲线,可判断无根藤属21个物种的适生环境。一般认为,当分布概率大于0.5时,其对应的生态因子值适宜物种的生长[33-34]。根据表4可以发现影响无根藤属狭域种地理分布的环境因子都有适宜阈值且阈值范围较小,而影响广布种无根藤分布的环境因子适宜阈值范围最大,且最冷季度最低温没有适宜阈值,初步推测只要大于9.4℃都是适宜生存的(见表4)。
基于刀切法检测主要环境变量对无根藤属物种分布影响的重要程度,研究发现,影响无根藤属物种潜在适生区模拟的正规化训练增益、测试增益值最高和AUC值最接近于1的环境变量都是同一个,但影响每个物种分布的主要环境变量有所不同(见表5)。气温季节性变动系数(bio04)是影响C. aurea、C. candida、C. ciliolata、C. glabella、C. muelleri、C. pondoensis和无根藤分布的最重要气候因子,最湿季度平均温(bio08)是影响C. capillaris和C. rufa分布的主要气候因子,降水季节性变化(bio15)主导了C. peninsularis和C. phaeolasias的分布,其余无根藤属物种的分布主要受最冷季度平均温(bio11)的限制(见表5)。
表 5 MaxEnt模型中基于刀切法检验的重要环境变量
Table 5. Importance of environmental variables in MaxEnt model based on Jacknife method
物种名称 气候变量 适宜区间 最适峰值 C. aurea bio04 288.9-476 369.3 C. candida bio04 165.5-262.1 187 C. ciliolata bio04 256.7-385.5 272.3 C. filiformis bio04 36.7-492.6 283.4 C. glabella bio04 240.6-471.2 369.3 C. muelleri bio04 305.0-396.2 353.2 C. pondoensis bio04 187.2-313.0 240.6 C. capillaris bio08 27.2-31.3 30.3 C. rufa bio08 25.2-29.3 27.4 C. flava bio11 11.1-14.7 13.6 C. flindersii bio11 7.1-10.9 9.0 C. melantha bio11 6.6-11.9 9.8 C. micrantha bio11 11.1-14.5 13.5 C. nodiflora bio11 9.5-13.8 11.2 C. paniculata bio11 10.7-14.5 12.8 C. peninsularis bio11 10.4-15.6 11.7 C. pomiformis bio11 10.0-14.5 12.9 C. pubescens bio11 5.6-12.1 9.7 C. racemosa bio11 10.4-14.5 13.3 C. pedicellosa bio15 0-95.8 0.0 C. phaeolasia bio15 8.4-13.9 9.7 综合环境变量的贡献率和刀切法分析,等温性(bio03)、最冷月份最低温(bio06)、最湿季度平均温(bio08)、气温季节性变动系数(bio04)和最冷季度平均温(bio11)等温度因子与最暖季度降水量(bio18)、降水季节性变化(bio15)和最干月份降水量(bio14)等降水因子是影响无根藤属物种地理分布格局的主要环境因子。
-
MaxEnt模型在模拟时主要基于环境相似性进行预测,广布种无根藤的适生范围与现有实际范围高度吻合,在世界范围内的热带亚热带地区都有高适生区,而狭域特有种如C. ciliolata、C. pondoensis、C. glabella、C. pubescens的适生区比现有实际分布范围要广,但高适生区仍与实际分布范围吻合。狭域种与广布种模拟结果的这种差异,可能受三个因素影响,一是广布种分布范围广,受关注程度高,采集的样本更多,记录的信息可能更准确,模拟结果相对更可靠;二是由于在进行模拟预测时,未考虑影响物种分布的其他因素(生物因素、局部的小气候等),而这些因素对狭域种的影响可能更大,从而导致其物种的潜在分布区大于实际分布区[35];三是狭域种没有合适的扩散通道突破现有的生存环境到同样适生的其他区域,造成适生区范围比实际分布范围大。
-
影响物种分布格局的环境因素众多,近年来大量研究表明,气候和土壤是影响植物分布范围的主要因素[4, 36, 37];此外,生理特性及扩散方式等也会影响植物的分布范围。气候因素对植物分布范围的影响最大,广布种往往比狭域种更容易分布在气候变异较大的区域[38]。本研究表明,影响无根藤属物种分布的主要因素是气候,其次才是土壤等环境因子,这一结果再次验证了气候因子是影响物种分布范围的最主要因素[39]。对无根藤属大多数物种而言,温度对其分布范围的影响大于降水,这可能与无根藤属植物寄生的生物学特性有关,种子在土壤中萌发后,需要找到周围的植物完成寄生过程,之后主要依靠寄主生存,因此对降水的直接需求不大。结合无根藤特性和模拟结果,气候对无根藤属植物分布范围的影响主要包括三个方面:一是气候适宜阈值限制了狭域种的分布范围,影响狭域种分布的气候因子适宜阈值范围小,影响广布种分布的气候因子适宜阈值范围比较大(如本研究中显示气温季节性变动系数,阈值范围差大于450),推测无根藤属广布种可能和大多数广布植物一样对极端气候有了很强的耐受性,或对气候多变性有了很强的适应性[40-41]。因此,广布种对环境的要求相对更低,对水热耐受范围大,可能是无根藤能广泛分布的原因之一。二是广布种对气候环境适应能力强,野外采样观察发现,无根藤既可以生长在低海拔的沿海沙滩地区,也可以生长在海拔大于1 000 m的热带雨林林窗和林缘区域,对生境的气候无特殊要求使无根藤能广泛分布。三是广布种的种子在休眠时不易被波动的环境所破坏,在温度达25 ℃和充足的水分条件下才可以解除休眠并发芽[21]。
种子萌发需要充足的水分、适宜的温度以及必要的氧气供应[42],土壤能为植物提供这些生长发育所需要的适宜条件[43],植物幼苗的生长发育也受不同区域的土壤含水量的影响[44-45]。因此,土壤因素对种子萌发和幼苗生长的影响可能限制了植物的分布范围。MaxEnt模拟的结果表明,除广布种无根藤外,其余狭域种的分布或多或少都受到土壤因子的影响,验证了土壤因素对局域分布植物的影响比广泛分布植物的影响大[38]。野外观察发现,无根藤在我国既分布在海边沙滩地带,也分布在常绿森林里,其生长对土壤基质没有特殊要求,推断其种子在全球范围内很多类型的土壤基质中都可以萌发,因此该物种能够在全球热带亚热带地区广布。而其他狭域种可能在种子休眠、萌发和幼苗生长等过程对土壤有特殊需求,因此大多数局限分布在澳大利亚等部分地区。
无根藤属物种对寄主的选择不是很明确[14],广布种无根藤属于兼性寄生[46],但有研究表明日本地区C. pergracilis的狭域分布与寄主和寄主的生境特异性有关[47]。因此,寄主物种的分布范围比较广泛可能也是无根藤能广泛分布于世界热带亚热带的一个因素,但确切结论还有待于深入研究。另外,无根藤的种子可能靠鸟类传播[14],能够实现长距离扩散;狭域种C. pubescens靠有袋类哺乳动物(Isoodon obesulus Shaw)传播[48],其传播范围相对有限。虽然其他狭域种的散布方式是不明确,但我们推测种子的长距离散布,加上温气候的耐受性较强及对土壤的良好适应能力,是无根藤能够在全球热带亚热带地区广布的重要因素。
-
无根藤属是樟科类群中特殊的一个分支,它的寄生特性可能是进化过程中产生的适应性特征,对该类群的认识有助于理解寄生植物的进化历史。有特殊进化历史的物种可能具有独特的遗传资产和进化潜能,是生态系统中不可或缺的一部分,保护这些物种有助于维护整个生态系统的稳定性,保持森林多样性的完整性。一般认为,狭域种更容易受到气候变化的威胁[49-50]。狭域分布的无根藤属物种受气候因子适宜阈值限制较大,对气候的适应能力最弱,对土壤因子的要求更严格,意味着未来气候变化可能会使其适生范围变小[51]。同时,部分物种会寄生在一些入侵植物上,从而成为抵御外来入侵物种的生物防治剂[52],如狭域种C. pubescens。因此,需要对无根藤属的狭域种进行必要的保护。
影响广布种无根藤分布的气候因子适宜阈值范围大,对气候的适应能力最强,意味着未来气候变化可能会让它分布范围更大[51];同时,无根藤几乎不受土壤因子的影响,它可以在世界范围内绝大部分土壤基质上萌发、生长并迅速扩散,它成为对地区林业和农业产生重大危害的潜在风险。现有研究表明,无根藤在某些地区能在植物间传播病原体,具有高感染性,会对农业和濒危植物构成威胁,严重时会导致濒危植物的死亡[53]。因此,需要在寄生过程及早期对它进行去除而达到有效防治的效果。
-
基于无根藤属的特性结合MaxEnt模拟结果,初步推测无根藤能够泛热带分布的原因主要有以下四点:一是影响无根藤分布的环境因子适宜阈值范围大,环境适应性强;二是种子萌发与幼苗生长不受土壤因子的限制,不受外界环境波动影响;三是种子可借助鸟类完成长距离扩散;四是寄主生长范围广。
MaxEnt模型是基于理想生态位而建立的,只考虑了部分因素对物种分布的影响[54],分布模型并不是完全准确的;此外,物种的分布格局也受到在静态的分布模型中可能无法完全考虑的种间竞争、迁移、扩散、灭绝等动态过程的影响[55];同时,研究仅使用了MaxEnt单一模型对数据进行分析,展开多模型对比和集成分析是未来的重要趋势。物种分布模型需要结合实地调查和长期监测数据来验证和修正,使用多种生态和环境因素建立多个模型以更好地理解物种的分布格局。
Prediction of potential distribution area of Cassytha (Lauraceae) based on MaxEnt model
More Information-
摘要: 樟科无根藤属物种绝大多数局限分布于澳大利亚,少数物种产于非洲,然而其中的一种却呈泛热带分布于世界各地。聚焦这一广布种(Cassytha filiformis)与狭域物种进行潜在适生区的模拟,分析它们形成适生区的环境差异,解析樟科无根藤属植物多样性分布格局及其成因,旨在为其所处森林多样性保护与生态环境稳定提供基础资料。结果表明,基于环境变量的MaxEnt模型训练集和测试集受试者工作特征曲线下面积(AUC值)均大于0.9,表明无根藤属物种的潜在分布区的预测具有极高的准确度,可信度好。基于环境变量贡献率和刀切法的结果表明,温度、降水和土壤是限制无根藤属物种分布的主要环境因素,其中狭域种的分布受土壤因子影响较大,广布种无根藤的分布几乎不受土壤因子限制,并且影响狭域特有种的地理分布格局的环境因子都有适宜阈值但阈值范围较小,只有主导无根藤分布的环境因子适宜阈值范围最大。初步推测无根藤广泛分布而其余物种狭域分布的原因有以下四点:(1)无根藤环境适应性强,影响无根藤分布的主导因子阈值范围大;(2)无根藤分布不受土壤因子限制;(3)无根藤种子能完成长距离扩散;(4)无根藤寄主范围广。Abstract: Most species of the genus Cassytha are confined in Australia, and a few species are found in Africa. However, Cassytha filiformis L. is a particular species is distributed all over the world in a pan-tropical manner. The purpose of this study is to simulate the potential suitable areas of this widely distributed species (C. filiformis) and narrow-range species, analyze the environmental differences of their suitable areas, and analyze the distribution pattern of the genus Cassytha diversity and the underlying causes, in order to provide basic information for the protection of forest diversity and the stability of ecological environment. The results showed that, based on environmental variables, the MaxEnt model had a high accuracy in predicting the potential distribution areas of the genus Cassytha. The area under the receiver operating characteristic curve (AUC value) was greater than 0.9 for both the training and test sets, indicating a good confidence in the predictions. Based on the contribution rate of environmental variables and the Jackknife method, the results showed that precipitation, temperature, and soil were the main factors limiting the distribution of the genus Cassytha species. The distribution of most narrow species were greatly affected by soil conditions, while the distribution of C. filiformis was not significantly limited by soil factors. Overall, the environmental factors affected the geographical distribution of the genus Cassytha species had suitable thresholds and narrow ranges, except for C. filiformis, which had the largest range of thresholds. It is currently tentatively hypothesized that the wide distribution of C. filiformis and the narrow distribution of the other species can be attributed to four reasons. Firstly, C. filiformis has strong environmental adaptability, and can tolerate a wide range of dominant factors that influence its distribution. Secondly, the distribution of this species is not limited by soil factors. Thirdly, the seeds of the C. filiformis can diffuse over a long distance. Lastly, this species has the ability to utilize a wide variety of hosts for its survival and reproduction.
-
Key words:
- MaxEnt model;
- Cassytha;
- potential distribution;
- climatic factors;
- soil factors
-
图 2 基于MaxEnt模型模拟的无根藤属物种潜在适生区
Fig. 2 Potential suitable distribution area of Cassytha based on MaxEnt model
表 1 无根藤属潜在适生区模拟的物种分布数据
Tab. 1 Species distribution data used for simulating potential suitable area of Cassytha
物种名称 分布
数据拟模拟
数据可否
模拟C. filiformis 8683 3997 可 C. aurea 248 153 可 C. candida 228 82 可 C. capillaris 857 466 可 C. ciliolata 476 137 可 C. flava 280 149 可 C. flindersii 138 49 可 C. glabella 18720 2999 可 C. graminicola 7 4 否 C. larsenii 6 2 否 C. melantha 5606 2201 可 C. micrantha 63 37 可 C. muelleri 21 14 可 C. nodifora 128 70 可 C. paniculata 217 87 可 C. pedicellosa 37 16 可 C. peninsularis 875 364 可 C. pergracilis 23 4 否 C. phaeolasia 2163 224 可 C. pomiformis 362 190 可 C. pondoensis 48 30 可 C. pubescens 14649 2960 可 C. racemosa 1053 439 可 C. rufa 63 47 可  下载: 导出CSV
表 2 用于物种分布区预测的环境变量
Tab. 2 Environmental variables for species distribution prediction
类型 环境变量 变量描述 气候因子 Bio01 年平均气温(℃) Bio03 等温性 Bio04 气温季节性变动系数 Bio06 最冷月份最低温度(℃) Bio08 最湿季度平均温度(℃) Bio09 最干季度平均温度(℃) Bio10 最暖季度平均温度(℃) Bio11 最冷季度平均温度(℃) Bio12 年降水量(mm) Bio14 最干月份降水量(mm) Bio15 降水量季节性变化(mm) Bio18 最暖季度降水量(mm) 太阳辐射 Srad05 5月太阳辐射 (kJ m−2d−1) Srad06 6月太阳辐射(kJ m−2d−1) Srad07 7月太阳辐射(kJ m−2d−1) Srad08 8月太阳辐射(kJ m−2d−1) Srad11 11月太阳辐射(kJ m−2d−1) Srad12 12月太阳辐射(kJ m−2d−1) 风速 wind01 1月风速(m s−1) wind04 4月风速(m s−1) wind05 5月风速(m s−1) wind12 12月风速(m s−1) 土壤因子 t-bs 上层土壤基本饱和度(%) t-ref-bulk 上层土壤容重(kg·dm−3) t-cec 上层土壤电导率(dS·m−1) t-clay 上层土壤粘土含量(%wt) t-ece 上层土壤的阳离子交换能力(cmol·kg−1) t-esp 上层土壤可交换钠盐(%vol) t-gravel 上层土壤碎石体积百分比(%) t-ph 上层土壤酸碱度 t-slit 上层土壤淤泥含量(%) t-teb 上层土壤交换性盐基(cmol·kg−1) t-usda 上层土壤USDA质地分类(1-13) 地形因子 Elevation 海拔(m) Slope 坡度(°) Aspect 坡向 土地覆盖类型 Glc 全球土地植被覆盖类型(1-23)
下载: 导出CSV
表 3 无根藤属21个物种的AUC值统计表
Tab. 3 Statistical table of AUC values of the Cassytha spp.
模拟物种 AUC 模拟物种 AUC C. aurea 0.987 C. nodiflora 0.996 C. candida 0.996 C. paniculata 0.996 C. capillaris 0.973 C. pedicellosa 0.999 C. ciliolata 0.994 C. peninsularis 0.984 C. filiformis 0.934 C. phaeolasia 0.990 C. flava 0.993 C. pomiformis 0.990 C. flindersii 0.996 C. pondoensis 0.992 C. glabella 0.903 C. pubescens 0.905 C. melantha 0.916 C. racemosa 0.981 C. micrantha 0.995 C. rufa 0.995 C. muelleri 0.999
下载: 导出CSV
表 4 主要气候因子对MaxEnt模型预测无根藤属物种分布的贡献率与适宜区间
Tab. 4 Relative contributions of the main environmental variables to the MaxEnt modelling and suitable ranges
物种名称 气候变量 贡献率/% 置换重要值/% 适宜区间 最适峰值 环境因子类别 总贡献率/% C. aurea bio06 23.3 21.8 4.1-17.3 6.9 温度 35.8 bio18 16 3.4 25.8-69.9 36.8 降水 34.2 bio08 12.5 22.9 8.9-20.7 11.5 土壤 19.7 C. candida bio12 25.6 44.1 1027.4-1602.3 1250.9 降水 57.0 bio14 18 0 0.4-1.5 0.9 土壤 29.3 t-esp 15.8 0.2 2.5-3.3 2.7 温度 7.8 C. capillaris bio18 15.5 7.9 103.0-665.9 268.5 降水 42.9 bio15 13.5 9.1 92.4-124.6 109.6 温度 35.8 bio03 12.4 3.6 40.0-52.4 49.1 土壤 12.0 C. ciliolata bio03 25.8 12.4 38.5-47.3 45.4 温度 40.1 bio04 14.2 44.4 256.7-385.5 272.3 降水 19.2 slope 11 1.3 0.6-6.3 3.7 土壤 9.7 C. filiformis bio06 43.2 18 > 9.4 > 26.6 温度 60.9 bio11 14 39.5 12.1-27.4 24.8 降水 26.7 bio12 13.8 8.5 676.0-6520.9 1299.8 土壤 1.1 C. flava bio08 23.3 53.5 12.1-27.4 13.8 温度 44.4 bio18 14.4 4.7 36.8-47.8 39.8 降水 30.0 bio14 12.9 3 6.9-13.4 9.1 土壤 16.2 C. flindersii bio03 24.1 25.8 37.1-42.4 39.4 温度 32.8 bio14 17.5 17.5 9.1-25.4 17.8 降水 26.4 slope 12.7 4.9 0.5-4.5 1.1 土壤 18.0 C. glabella bio06 35.1 3.2 3.4-11.0 7.9 温度 55.1 bio14 23.9 9.4 15.6-77.7 49.3 降水 23.9 bio04 12 67.5 240.7-471.3 364.0 土壤 14.0 C. melantha bio03 28.3 1.5 35.6-42.1 38.1 温度 47.6 bio17 23.7 2.4 99.4-204.5 157.0 降水 23.7 bio11 12 1.6 3.6-4.2 9.8 土壤 11.2 C. micrantha bio18 24.3 5.7 36.8-47.8 47.8 降水 44.1 bio14 15.8 7.5 8.0-27.6 13.4 土壤 22.5 bio03 13.4 0 35.6-42.2 37.5 温度 19.6 C. muelleri bio04 29.5 67.7 305.0-396.2 353.2 温度 48.4 bio15 13.3 7.4 22.5-42.9 32.7 降水 19.3 bio06 10.2 0 7.9-10.0 8.9 土壤 12.6 C. nodiflora bio03 15.1 0.3 37.3-41.6 39.4 温度 35.2 bio18 14.9 0.5 36.8-58.9 47.8 降水 28.8 t-esp 14 0.2 4.0-10.6 5.4 土壤 22.9 C. paniculata bio14 25.3 1.4 38.5-117.0 70.0 温度 45.9 bio06 24 30 7.8-12.3 9.5 降水 31.0 bio04 18.1 43.6 235.3-417.7 364.0 温度 45.9 C. pedicellosa bio04 23.8 2.7 0-95.8 0.0 温度 41.0 evle 14.2 3.4 0-163.0 0.0 降水 25.4 bio15 13.7 0 0-17.0 0.0 土壤 15.1 C. peninsularis bio18 29.8 16.5 0- 257.5 3.6 降水 51.2 bio06 19.3 3.8 7.1-10.9 8.2 温度 33.4 bio17 17.5 3.2 35.0-48.6 41.7 土壤 10.4 C. phaeolasia bio15 28.8 5.3 8.4-13.9 9.7 降水 47.4 glc 27.6 3.5 1、2、3 1 温度 19.0 bio14 18.6 9.4 54.8-70.7 62.4 土壤 11.7 C. pomiformis bio08 25.9 55.8 10.8-14.3 12.7 温度 49.0 t-slit 14.4 1.7 5.9-14.1 6.5 降水 22.2 C. pomiformis bio06 13.1 32.7 10.8-14.3 9.8 土壤 19.3 C. pondoensis bio03 28.8 1.1 46.6-56.0 50.3 温度 48.2 bio12 14.6 0.9 803.3-1554.4 1266.9 降水 20.2 bio11 13.6 0.7 15.1-20.0 19.1 土壤 13.7 C. pubescens bio14 33.3 12.7 32.0-74.5 53.7 温度 49.6 bio06 18.1 2.8 1.9-9.9 6.2 降水 33.3 bio03 17.9 4.1 34.3-41.1 39.4 土壤 11.5 C. racemosa bio08 21.8 11 10.6-14.7 13.1 温度 52.2 bio03 16.2 10.2 34.3-41.1 38.5 降水 23.3 bio06 14.2 6.1 7.3-11.8 10.3 土壤 15.8 C. rufa bio03 25.3 6.1 38.2-53.3 44.0 温度 30.4 bio18 17.3 26.9 290.7-3050.1 423.1 降水 28.8 t-ece 8.8 7.2 0.1-0.3 0.2 土壤 23.3
下载: 导出CSV
表 5 MaxEnt模型中基于刀切法检验的重要环境变量
Tab. 5 Importance of environmental variables in MaxEnt model based on Jacknife method
物种名称 气候变量 适宜区间 最适峰值 C. aurea bio04 288.9-476 369.3 C. candida bio04 165.5-262.1 187 C. ciliolata bio04 256.7-385.5 272.3 C. filiformis bio04 36.7-492.6 283.4 C. glabella bio04 240.6-471.2 369.3 C. muelleri bio04 305.0-396.2 353.2 C. pondoensis bio04 187.2-313.0 240.6 C. capillaris bio08 27.2-31.3 30.3 C. rufa bio08 25.2-29.3 27.4 C. flava bio11 11.1-14.7 13.6 C. flindersii bio11 7.1-10.9 9.0 C. melantha bio11 6.6-11.9 9.8 C. micrantha bio11 11.1-14.5 13.5 C. nodiflora bio11 9.5-13.8 11.2 C. paniculata bio11 10.7-14.5 12.8 C. peninsularis bio11 10.4-15.6 11.7 C. pomiformis bio11 10.0-14.5 12.9 C. pubescens bio11 5.6-12.1 9.7 C. racemosa bio11 10.4-14.5 13.3 C. pedicellosa bio15 0-95.8 0.0 C. phaeolasia bio15 8.4-13.9 9.7
下载: 导出CSV
-
[1] 杨旭,徐阳,龚榜初,等. 大别山区两种柿资源种实表型性状的多样性[J]. 林业科学研究,2022, 35(4):188−196. [2] Kearney M, Porter W. Mechanistic niche modelling: combining physiological and spatial data to predict species' ranges[J]. Ecology Letters, 2009, 12(4): 334−350. doi: 10.1111/j.1461-0248.2008.01277.x [3] 刘宪钊,韩文斌,高瑞东,等. 不同环境类型对华北落叶松分布的潜在影响[J]. 生态学报 ,2021,41(5):885−1893. [4] 张东方,张琴,郭杰,等. 基于MaxEnt模型的当归全球生态适宜区和生态特征研究[J]. 生态学报,2017, 37(15):5111−5120. [5] 马剑,刘贤德,金铭,等. 祁连山青海云杉林土壤理化性质和酶活性海拔分布特征[J]. 水土保持学报,2019, 33(02):207−213. [6] 郭燕青,史梦竹,李建宇,等. 基于Maxent模型的假臭草潜在分布区预测[J]. 热带亚热带植物学报,2019, 27(3):250−260. [7] 张晓玮,蒋玉梅,毕阳,等. 基于MaxEnt模型的中国沙棘潜在适宜分布区分析[J]. 生态学报,2022, 42(4):1420−1428. [8] 廖剑锋,易自力,李世成,等. 基于Maxent模型的双药芒不同时期潜在分布研究[J]. 生态学报,2020, 40(22):8297−8305. [9] 山丹,朱媛君,王百竹,等. 呼伦贝尔沙地北部沙带植物群落分布格局与土壤特性的关系[J]. 中国沙漠,2020, 40(01):145−155. [10] 赵鹏,屈建军,韩庆杰,等. 敦煌绿洲边缘植物群落与土壤养分互馈关系[J]. 中国沙漠,2018, 38(4):791−799. [11] Corlett R T, Tomlinson K W. Climate change and edaphic specialists: irresistible force meets immovable object? [J]. Trends in Ecology & Evolution, 2020, 35(4):367−376. [12] 宁瑶,雷金睿,宋希强,等. 石灰岩特有植物海南凤仙花潜在适宜生境分布模拟[J]. 植物生态学报,2018, 42(9):946−954. [13] Francisco-Ortega J, Wang F G, Wang Z S, et al. Endemic seed plant species from Hainan island: a checklist[J]. The Botanical Review, 2010, 76(3): 295−345. doi: 10.1007/s12229-010-9054-8 [14] Weber J. A taxonomic revision of <italic>Cassytha</italic> (Lauraceae) in Australia[J]. Journal of the Adelaide Botanic Gardens, 1981, 3(3): 187−262. [15] Awang K, Conran J G, Waycott M, et al. Cuticular and ultrastructure characters on Cassytha L. (Lauraceae) Stem[J]. 2018. Available online at:https://www.researchgate.net/publication/325870821 (accessed November 18, 2022). [16] Diniz M A. Lauraceae of the Flora Zambesiaca area[J]. Kirkia,1996,16(1):55−68 [17] Wardini T H. Plant Resources of South-East Asia[J]. Taxon, 2001, 3(2): 164. [18] Li H W, Li J, Huang P H, et al. Lauraceae [M]// Wu Z Y, Peter H, Raven. Flora of China. vol. 7. Beijing, China and Missouri, USA: Science Press and Missouri Botanical Garden Press, 2008: 102–254. [19] 李扬汉,姚东瑞. 寄生杂草无根藤的特性,危害与防除[J]. 杂草科学,1991(3):4−5. [20] Mahadevan N, Jayasuriya K M G G. Water-impermeable fruits of the parasitic angiosperm <italic>Cassytha filiformis</italic> (Lauraceae): confirmation of physical dormancy in Magnoliidae and evolutionary considerations[J]. Australian Journal of Botany, 2013, 61(4): 322−329. doi: 10.1071/BT12275 [21] Heide-Jørgensen, H S. Parasitic Flowering Plants[M]. Leiden: Koninklijke Brill NV, 2008. [22] Muir, J. The beach drift of South Africa[J]. South African Journal of Botany, 1993, 18: 5−10. [23] Philips S P, Anderson R P, Schapire R E. Maximum entropy modeling of species geographic distribution[J]. Ecological Modeling, 2006, 190(3/4): 231−259. [24] 陈新美,雷渊才,张雄清,等. 样本量对MaxEnt模型预测物种分布精度和稳定性的影响[J]. 林业科学,2012, 48(1):53−59. [25] Luo X, Hu Q J, Zhou P P, et al. Chasing ghosts: Allopolyploid origin of <italic>Oxyria sinensis</italic> (Polygonaceae) from its only diploid congener and an unknown ancestor[J]. Molecular Ecology, 2017, 26(11): 3037−3049. doi: 10.1111/mec.14097 [26] 王璐,许晓岗,李垚. 末次盛冰期以来陀螺果潜在地理分布格局变迁预测[J]. 生态学杂志,2018, 37(1):278−286. [27] 王运生,谢丙炎,万方浩,等. ROC曲线分析在评价入侵物种分布模型中的应用[J]. 生物多样性,2007, 15(4):365−372. [28] 李振华,王艳芳,伊勒泰,等. 阿拉善地区荒漠肉苁蓉生态适宜性区划研究[J]. 中国中药杂志,2015, 40(5):785−792. [29] 秦思思,颜玉娟,欧阳晟. 基于MaxEnt模型和ArcGIS预测蜡梅适生域在中国的潜在分布[J]. 生态科学,2020,39(3):49−56. [30] Vanagas G. Receiver operating characteristic curves and comparison of cardiac surgery risk stratification systems[J]. Interactive Cardio Vascular & Thoracic Surgery, 2004, 3(2): 319−322. [31] 朱耿平,刘国卿,卜文俊,等. 生态位模型的基本原理及其在生物多样性保护中的应用[J]. 生物多样性,2013, 21(1):90−98. [32] 李璇,李垚,方炎明. 基于优化的MaxEnt模型预测白栎在中国的潜在分布区[J]. 林业科学,2018, 54(8):153−164. [33] 麻亚鸿. 基于最大熵模型(MaxEnt)和地理信息系统(ArcGIS)预测藓类植物的地理分布范围—以广西花坪自然保护区为例[D]. 上海:上海师范大学,2013. [34] 张雷,王琳琳,刘世荣,等. 生境概率预测值转换为二元值过程中4个阈值选择方法的比较评估—以珙桐和杉木生境预估为例[J]. 植物生态学报,2017, 41(4):387−395. [35] Yang X Q, Kushwaha S P S, Saran S, et al. Maxent modeling for predicting the potential distribution of medicinal plant, <italic>Justicia adhatoda</italic> L. in Lesser Himalayan foothills[J]. Ecological Engineering, 2013, 51: 83−87. doi: 10.1016/j.ecoleng.2012.12.004 [36] 张雪妮,杨晓东,吕光辉. 水盐梯度下荒漠植物多样性格局及其与土壤环境的关系[J]. 生态学报,2016, 36(11):3206−3215. [37] Fan B, Tao W, Qin G ,et al. Soil micro-climate variation in relation to slope aspect, position, and curvature in a forested catchment[J]. Agricultural and Forest Meteorology, 2020, 290: 107999. doi: 10.1016/j.agrformet.2020.107999 [38] Huang E, Chen Y, Fang M, et al. Environmental drivers of plant distributions at global and regional scales[J]. Global Ecology & Biogeography, 2021, 30(3): 697−709. [39] Babst F ,Bouriaud O ,Poulter B, et al. Twentieth century redistribution in climatic drivers of global tree growth[J]. Science Advances, 2019, 5(1): eaat4313. doi: 10.1126/sciadv.aat4313 [40] Addo-Bediako A, Chown S L, Gaston K J. Thermal tolerance, climatic variability and latitude[J]. Proceedings of the Royal Society:Biological Sciences, 2000, 267(1445): 739−745. doi: 10.1098/rspb.2000.1065 [41] Sunday J, Bennett J M, Calosi P, et al. Thermal tolerance patterns across latitude and elevation[J]. The Royal Society, 2019, 374(1778). doi: 10.1098/RSTB.2019.0036 [42] 朱淑娟,王方琳,刘有军,等. 土壤水分和种子大小对梭梭种子萌发,出苗和幼苗生长的影响[J]. 西北林学院学报,2021(6):16−21. [43] Onwuka, B, Mang, B. Effects of soil temperature on some soil properties and plant growth[J]. Plants & Agriculture Research, 2018, 8(1): 34−37. [44] Song X, Nakamura A, Sun Z, et al. Elevational distribution of adult trees and seedlings in a tropical montane transect, Southwest China[J]. Mountain Research & Development, 2016, 36: 342−354. [45] Song X Y, Li J Q, Zhang WF, et al. Variant responses of tree seedling to seasonal drought stress along an elevational transect in tropical montane forests[J]. Scientific Reports, 2016, 6: 36438. doi: 10.1038/srep36438 [46] 弓明钦. 无根藤生物学特性及其危害的初步研究[J]. 热带林业,1986(2):7−13. [47] Kokubugata G, Yokota M. Host Specificity of <italic>Cassytha filiformis</italic> and <italic>C. pergracilis</italic> (Lauraceae) in the Ryukyu Archipelago[J]. Bulletin of the National Museum of Nature & Science, 2012, 38(2): 47−53. [48] Maciunas, E. C., Watling, J. R., Facelli, J. M., et al. Seed traits and fate support probable primary dispersal of a native hemi-parasitic vine Cassytha pubescens (Lauraceae) by Isoodon obesulus, an endangered marsupial, in southern Australia[J]. Transactions of the Royal Society of South Australia, 2022, 146(2): 249–261. [49] Staude I R, Navarro L M, Pereira, H M. Range size predicts the risk of local extinction from habitat loss. Global Ecology & Biogeography, 2020, 29(1): 16–25. [50] Xu W B, Svenning J C, Chen G K, et al. Human activities have opposing effects on distributions of narrow-ranged and widespread plant species in China[J]. Proceedings of the National Academy of Sciences, 2019, 52: 26674−26681. [51] Zhang L, Jing Z, Li Z, et al. Predictive Modeling of Suitable Habitats for Cinnamomum Camphora (L.) Presl Using Maxent Model under Climate Change in China[J]. International Journal of Environmental Research and Public Health, 2019, 16(17): 3185. doi: 10.3390/ijerph16173185 [52] Tˇešitel J, Cirocco R M, Facelli J M, et al. Native parasitic plants: biological control for plant invasions? [J] Applied Vegetation Science, 2020, 23: 464–469. [53] Nelson S C. Cassytha filiformis[J]. Plant Disease, 2008, 42. [54] 蔡静芸,张明明,粟海军,等. 生态位模型在物种生境选择中的应用研究[J]. 经济动物学报,2014, 18(1):47−52. [55] 乔慧捷,胡军华,黄继红. 生态位模型的理论基础、发展方向与挑战[J]. 中国科学:生命科学,2013, 43(11):915−927. -

 点击查看大图

计量
- 文章访问数: 165
- HTML全文浏览量: 137
- PDF下载量: 18
- 被引次数: 0