


-
IPCC 第四次气候评估报告指出,全球气候变化已成事实[1],在过去的100年中(1906年至2005年),中国的年平均地表气温明显上升[2],气候变暖对生态系统的结构、功能,群落组成及物种分布等都会产生影响[3-6]。昆虫是动物界种类最多,数量最大的变温动物,气候变化直接作用于昆虫的行为、发育、分布、生殖和生存[7],对农林业生产和人类健康存在重要影响[8-9]。
物种分布模型(species distribution models, SDM)是一种重要的生物地理学手段,已被广泛用于对可能存在的生物栖息地进行预测,并对其进行地理分布规律研究[10-12]。已有14种被广泛使用 [13-16],而 MaxEnt模型是最准确的一个,它具有操作简单,计算时间短,结果稳定,用量少等优点。近年来,利用Max Ent模型,已经成功预测稻水象甲(Lissorhoptrus oryzophilus) [17]、锈色棕榈象(Rhynchophorus ferrugineus)[18]、西藏飞蝗(Locusta migratoria tibetensis)[19]和悬铃木方翅网蝽(Corythucha ciliate)[20]等昆虫在国内适生区。
松褐天牛(Monochamus alternatus),又称松墨天牛,是鞘翅目(Coleoptera) 天牛科 (Cerambycidae)的一种昆虫[21],主要为害马尾松(Pinus massoniana),其次为害云杉(Picea asperata) 、冷杉(Abies fabri )等,其成虫是松材线虫(Bursaphelenchus xylophilus)的主要携带者,体内所携带的扩散型4龄松材线虫在松墨天牛补充营养和取食过程中,通过伤口感染健康松树。被感染的健康松树在短期内因脱水死亡,从而引起松树枯死[21-23]。目前尚无可行的方法来预防和治理松材线虫病,因而通过控制松墨天牛这一传播媒介,从而控制松材线虫病的扩散显得尤为关键。随着气候变暖,昆虫发生期提前,其地理分布朝着更高纬度和更高海拔地区扩散[1]。目前,我国在害虫与气候变暖关系方面的研究主要集中在农业害虫上[24]。对松墨天牛的研究多集中于生物学特性、防治方法等方面[25-29],而对于松墨天牛在全国范围的预测预警研究较少。为了探索松墨天牛合理区划的有效手段,通过结合MaxEnt模型和GIS技术,模拟其在中国的潜在分布区。预测、对比、分析未来3种气候情景(RCP2.6、RCP4.5和RCP8.5)下松墨天牛的分布范围、空间格局和中心点位移的变化趋势,为未来应对气候变化提供基础数据支持。
-
选取MaxEnt模型软件,预测松墨天牛在中国的适生区分布。登录普林斯顿大学Robert Schapire计算机科学研究中心主页,可免费下载,最新版本为3.3.3k版[30]。通过ArcGIS预测松墨天牛实际及潜在分布区。
-
运用生态位模型模拟物种适生区时[31-32],首先通过访问四川省林业有害生物综合信息系统(sc.30120.org/fpgis/secure/Login.aspx?ReturnUrl=%2ffpgis%2f)获取在2012—2016年间四川境内松墨天牛的分布数据[6];通过查询物种分布数据库、参考已发表的文献资料,获取其余地区松墨天牛分布数据。
查询的数据库包括:“国际农业与生物科学中心数据库(CABI,
http://www.cabi.org/ ) ”、“全球物种多样性信息库(GBIF,http://www.gbif.org/ )”、“中国西南地区动物资源数据库(http://www.swanimal.csdb.cn )”以及教学标本资源共享平台 (http://mnh.scu.edu.cn/ )。利用Google Earth查询各分布点的经纬度,根据要求,剔除重复、模糊及相邻记录的分布点,得到全省680个分布点,其他地区371个,最后用 Excel对得到的经纬度数进行处理,以*. CSV的格式保存 [33]。 -
环境变量为1970-2000年间的67个环境变量,其中包括19个生物气候变量和月平均气候数据(见表1)。环境变量数据从worldclim网站(
http://www.worldclim.org/version2 )中下载。IPCC第五次评估中公布了4条典型污染路径(RCP2.6, RCP4.5, RCP6.0, RCP8.5)[22]。其中 RCP4.5和 RCP6.0均为中等水平CO2排放情景,且前者优先性大于后者,所以选取最低(RCP2.6)、中等(RCP4.5)和最高(RCP8.5)3种排放情景作为未来气候数据。未来时间范围包括2050 s (2041—2060年) 和2070 s (2061—2080年)[34],数据可以从国际热带农业中心 (CIAT) 网站下载[35]。生物气候特征bioclimatic characteristics 缩写abbreviation 年平均气温 bio1 平均气温日较差 bio2 等温性 bio3 气温季节性变动系数(标准差*100) bio4 最热月份最高温度 bio5 最冷月份最低温度 bio6 气温年较差 bio7 最湿季度平均温度 bio8 最干季度平均温度 bio9 最暖季度平均温度 bio10 最冷季度平均温度 bio11 年降水量 bio12 最湿月份降水量 bio13 最干月份降水量 bio14 降水量季节性变化 bio15 最干季度降水量 bio16 最湿季度降水量 bio17 最暖季度降水量 bio18 最冷季度降水量 bio19 最低温度 tmin 最高温度 tmax 平均温度 tavg 降水量 prec Table 1. List of bioclimatic characteristics
-
选取比例尺为1:4 000 000的中国国界、省界和县界行政区划图作为分析的底图。数据可从国家基础地理信息中心(
http://www.ngcc.cn/ )获取。 -
为避免模型过度拟合、提高模拟精度,分析预测物种分布通用的19个生物气候变量和月平均气候数据之间的相关性,去掉相关度高但对MaxEnt模型预测结果贡献不大的变量[6,36]。参考Worthington等方法[37]筛选潜在环境变量:首先利用刀切法 (Jackknife)测定环境变量对模型预测的贡献大小,去除贡献小的变量。其次,利用SPSS软件进行spearman相关分析进一步筛选关键的限制因子,并对相关系数|r|≥0.8的变量进行评估。对比初始模型中的贡献率,剔除贡献率小的变量,以提高模型模拟精度。通过这些分析方法,我们能够精确地确定那些高度相关但对模型预测结果贡献不大的变量,并将其排除在分析范围之外,从而得到更可靠和准确的结果。
-
使用MaxEnt模型对其进行分析,将松墨天牛分布点数据和环境因子数据作为输入。为了建立预测模型,随机选取75%的松墨天牛分布点作为训练集(training data)。剩余25%松墨天牛分布点作为测试集(test data)验证模型。选取刀切法来测定各变量的权重、选择创建环境变量响应曲线,其余参数为模型的默认值。通过 ArcGIS工具箱中的格式化转换工具,将模式中的数据转换成 Raster格式,从而可以在 ArcGIS中进行显示。使用 MaxEnt软件进行计算,通过ROC (receiver operating characteristic)曲线分析法,评价模拟结果的精度。在ROC曲线分析法中,数值的范围介于0到1之间,数值越接近1,表示物种存在的可能性越大。曲线下面积即AUC值反映预测精度,理论取值范围为0.5到1,值越接近1,表示精度越高。评价标准见(见表2) [6,17-19]。
AUC值范围Range of AUC value 评价标准Evaluation criterion 0.5≤AUC<0.6 失败 0.6≤AUC<0.7 不佳 0.7≤AUC<0.8 较好 0.8≤AUC<0.9 好 ≥0.9 极好 Table 2. Evaluation criterion of AUC
-
通过刀切法评估不同环境变量对松墨天牛潜在适生区预测的贡献。计算“仅该变量”、“除此变量”和“所有变量”模拟时的训练得分,“仅该变量”得分较高,说明该因子预测能力较强,对物种分布作用大;“除此变量”得分显著降低,说明其携带更多的独特信息,对物种分布较为重要[33,38]。
-
根据松墨天牛的实际情况,参考IPCC报告中有关可能性评估的划分方法,利用“重新分类”功能[38],设置不同等级的分布值,标准为:概率<0.05为非适生区;0.05≤概率<0.33为低适生区;0.33≤概率<0.66为中适生区;概率≥0.66为高适生区。
-
参考Yue等人的计算方法[38-39],统计高适生区不同时段的面积变化情况及其质心的位移,计算公式如下:
式中:t表示不同时段;I为高适生区的单位栅格数目;si(t)为时段t的单位栅格面积;s(t)为时段t中高适生区的总面积;(Xi(t),Yi(t))为时段t中高适生区单位栅格的质心坐标; (X(t),Y(t))为时段t中高适生区的质心坐标。
式中:D为时段t到t+1的高适生区位移距离;θ 为时段t到t+1的高适生区位移方向,0°<θ<90°表示位移方向为东北,90°<θ<180°表示位移方向为西北,180°<θ<270°表示位移方向为西南,270°<θ<360°表示位移方向为东南。
-
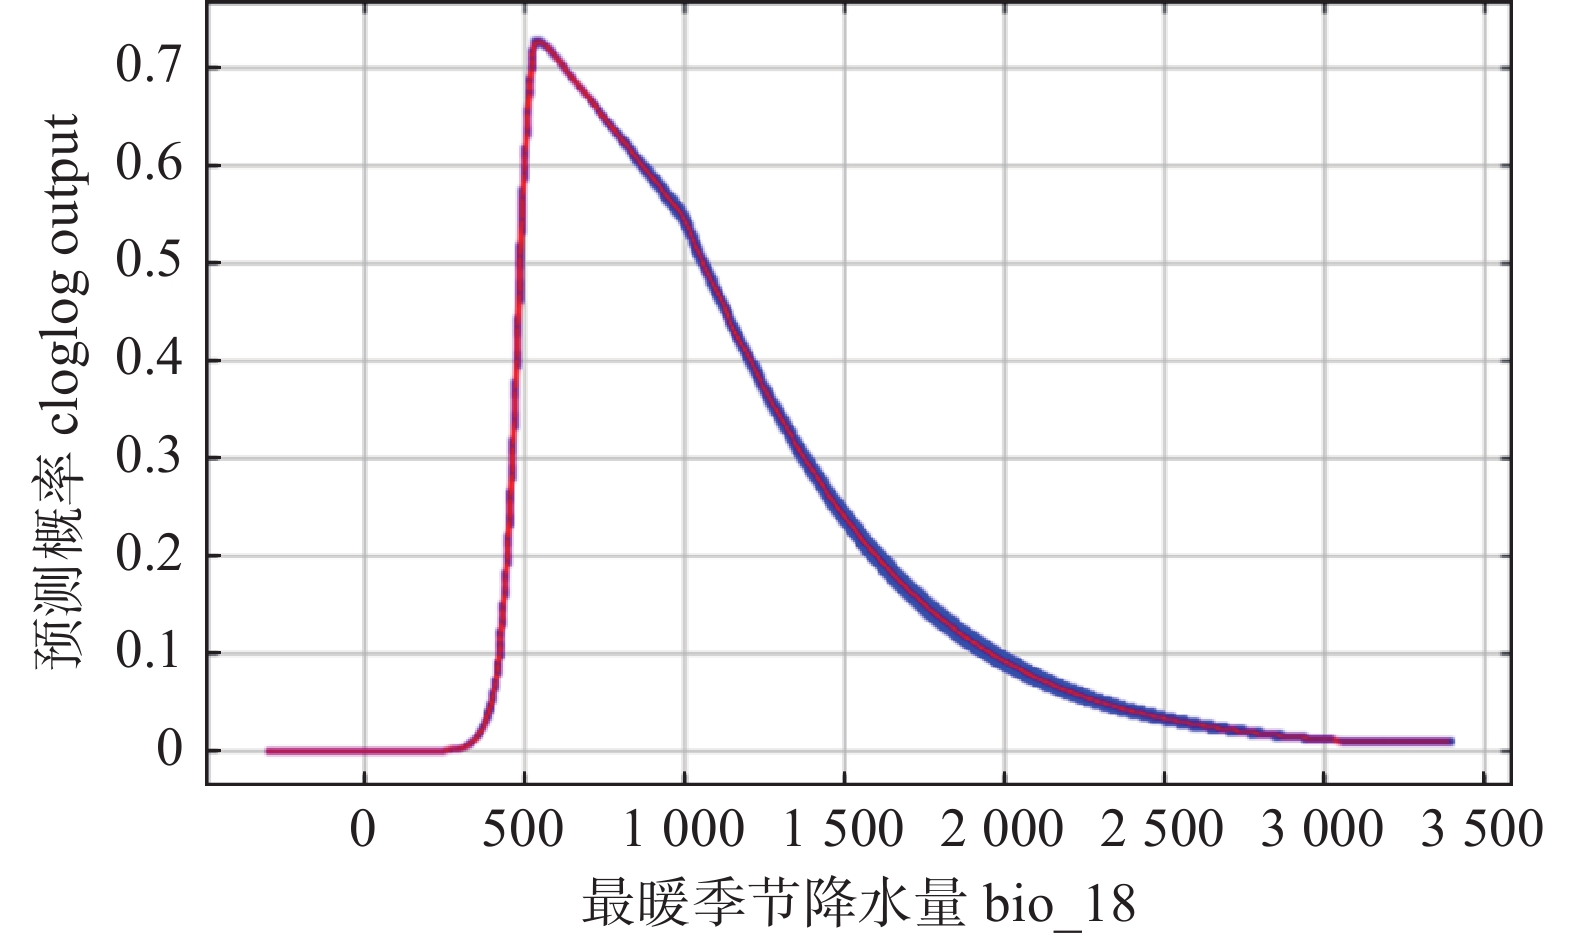
选择19个生物气候变量和月平均气候数据作为初始环境变量,研究表明[40-41],变量之间的自相关等问题会在预测过程中引入冗余信息,影响预测结果。经过环境变量的筛选后,保留了9个主要环境变量,在此基础上重建松墨天牛在中国分布的最大熵模型。刀切法检验结果显示(见图1) ,对松墨天牛分布贡献前三的环境变量依次为:最暖季降雨量(bio18)、2月最高温(tmax2)、1月最高温(tmax1),根据变量贡献标准,bio18贡献率最大,最适最暖季降雨量为550 mm(见图2),松墨天牛分布随降雨量增多而增加,当超过最大降雨量时,分布减少。

Figure 1. Test results of environmental factors by knife cutting method
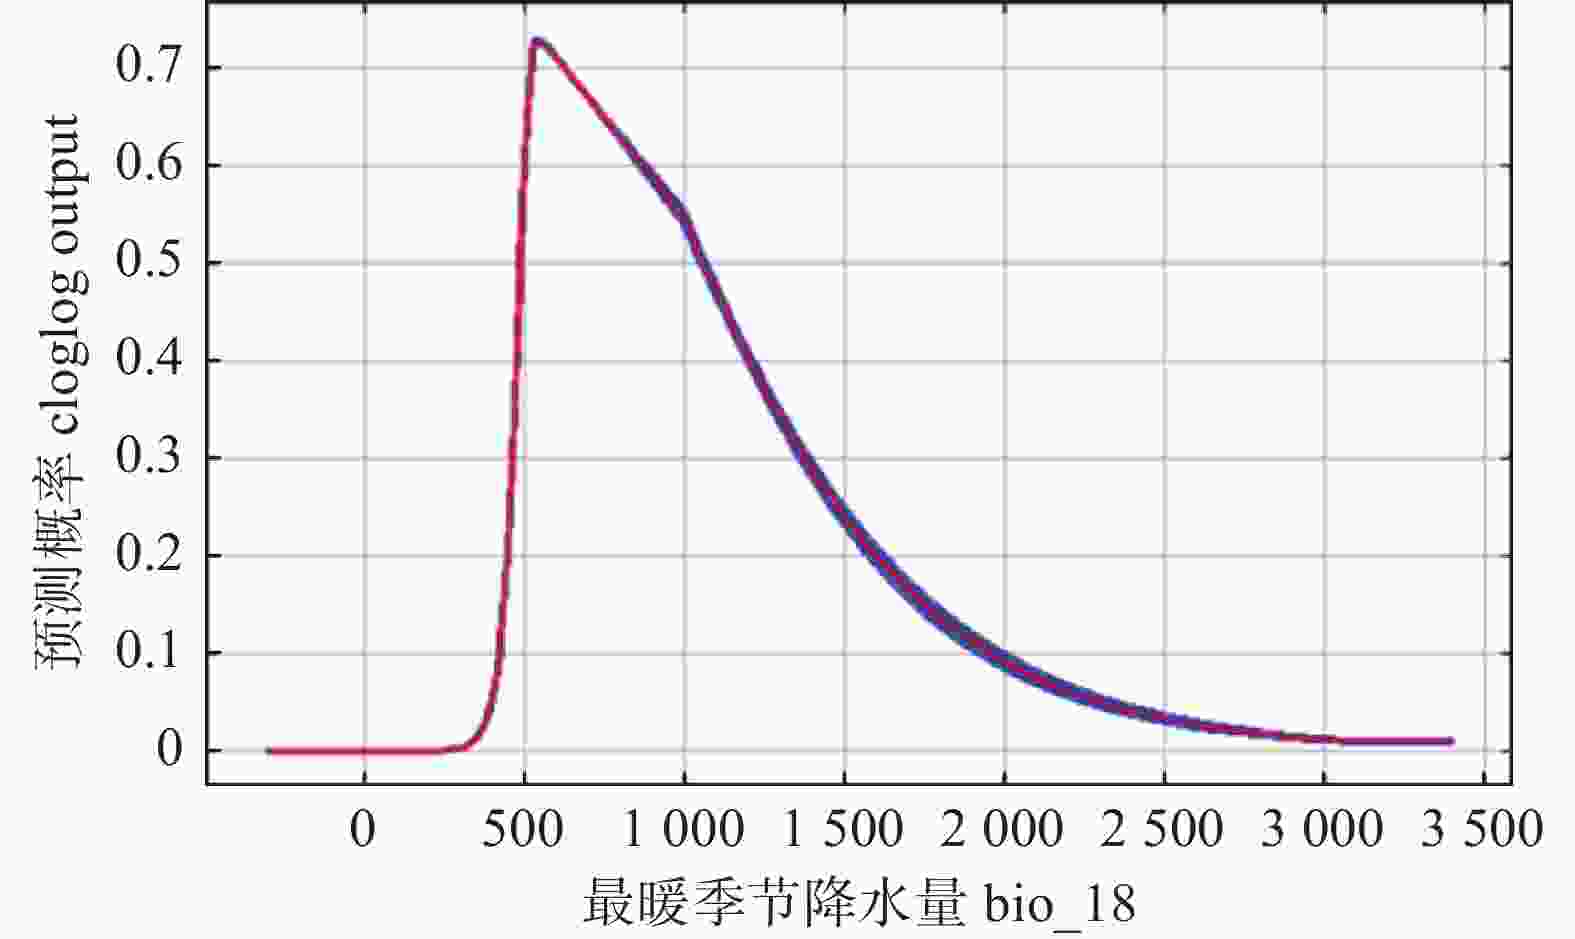
Figure 2. Rainfall in the warmest season (bio 18)
-
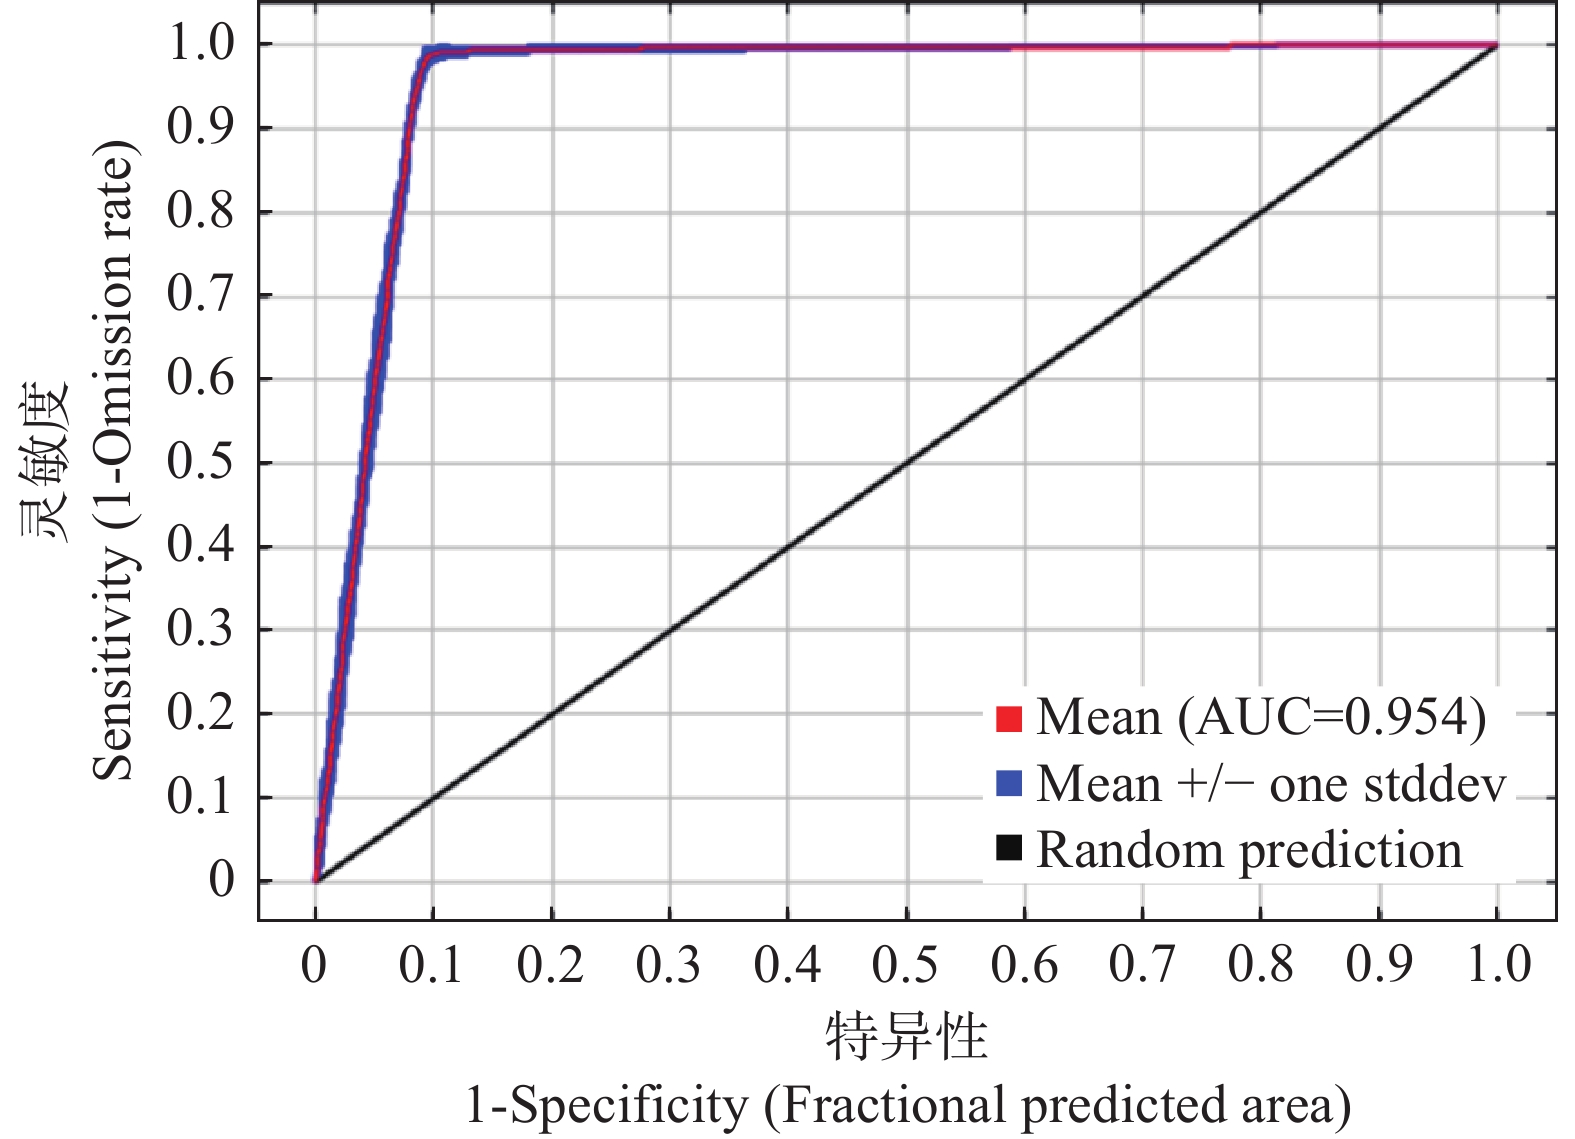
图3中基于主导环境变量构建的松墨天牛在中国分布模型的AUC值为0.954,为“极好”标准;图4中所有预测结果AUC值也达到“极好”标准。表明预测 可信度较高,可用于分析气候变化对松墨天牛在中国分布的影响。
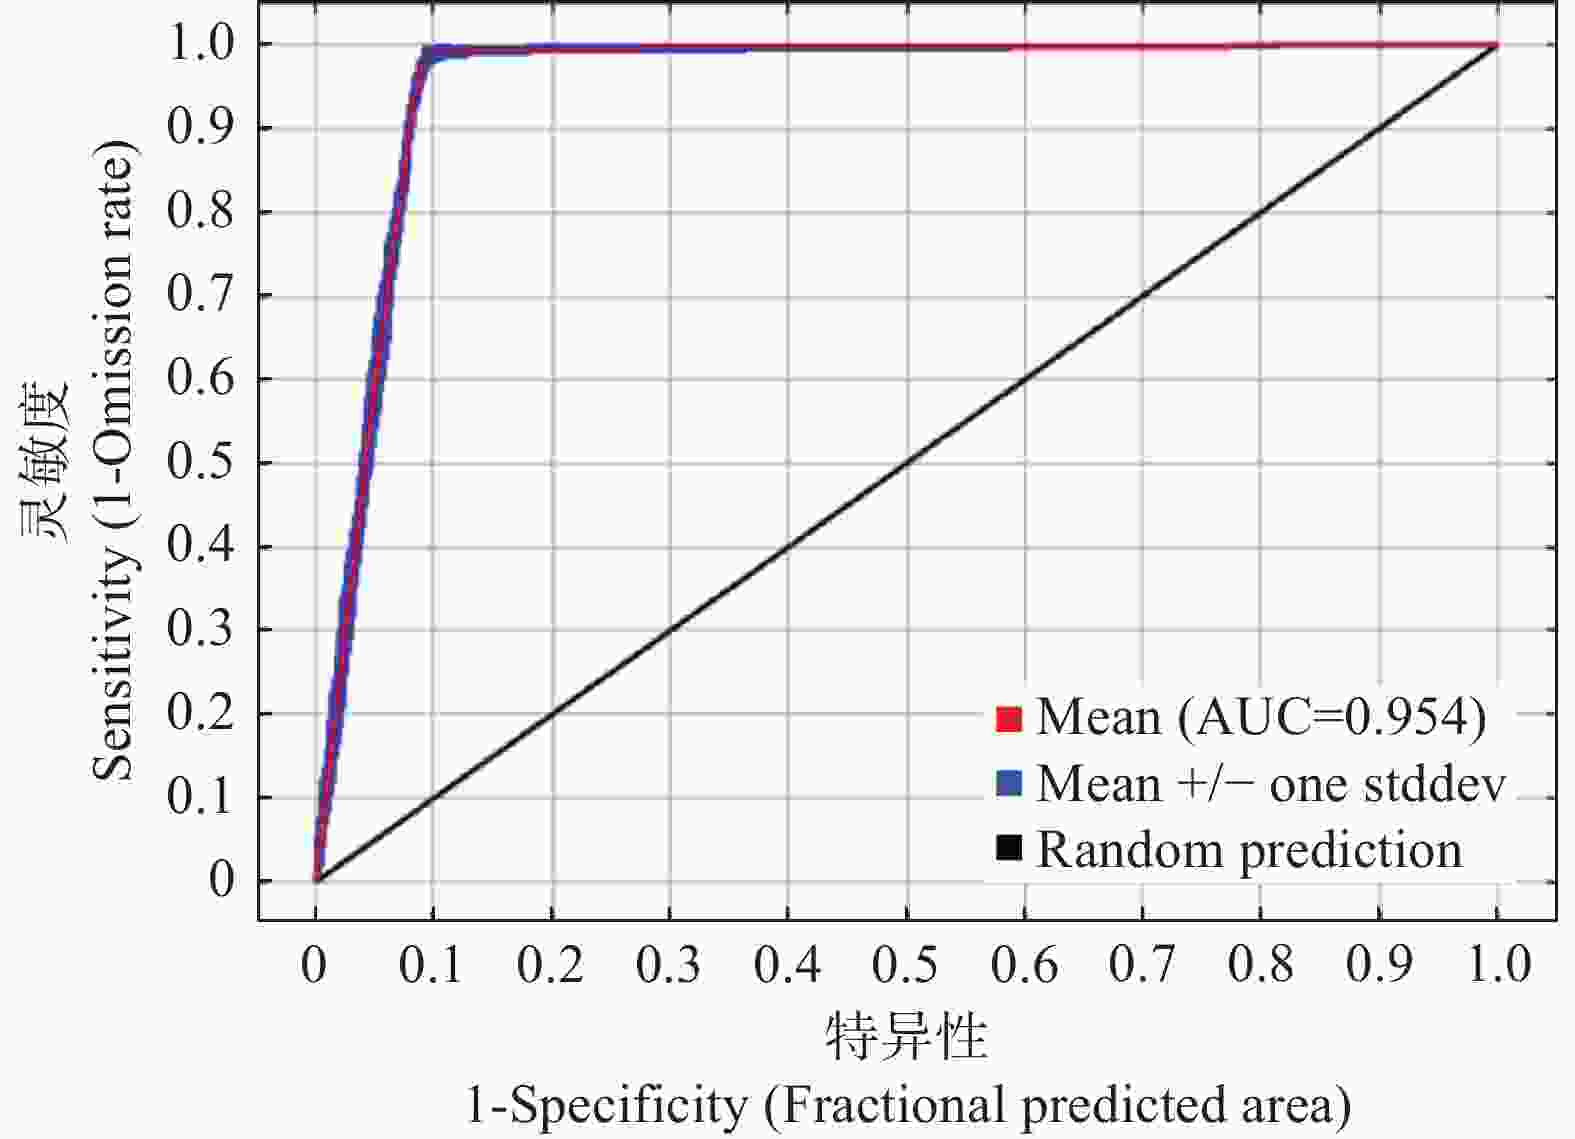
Figure 3. ROC curve under current climate conditions
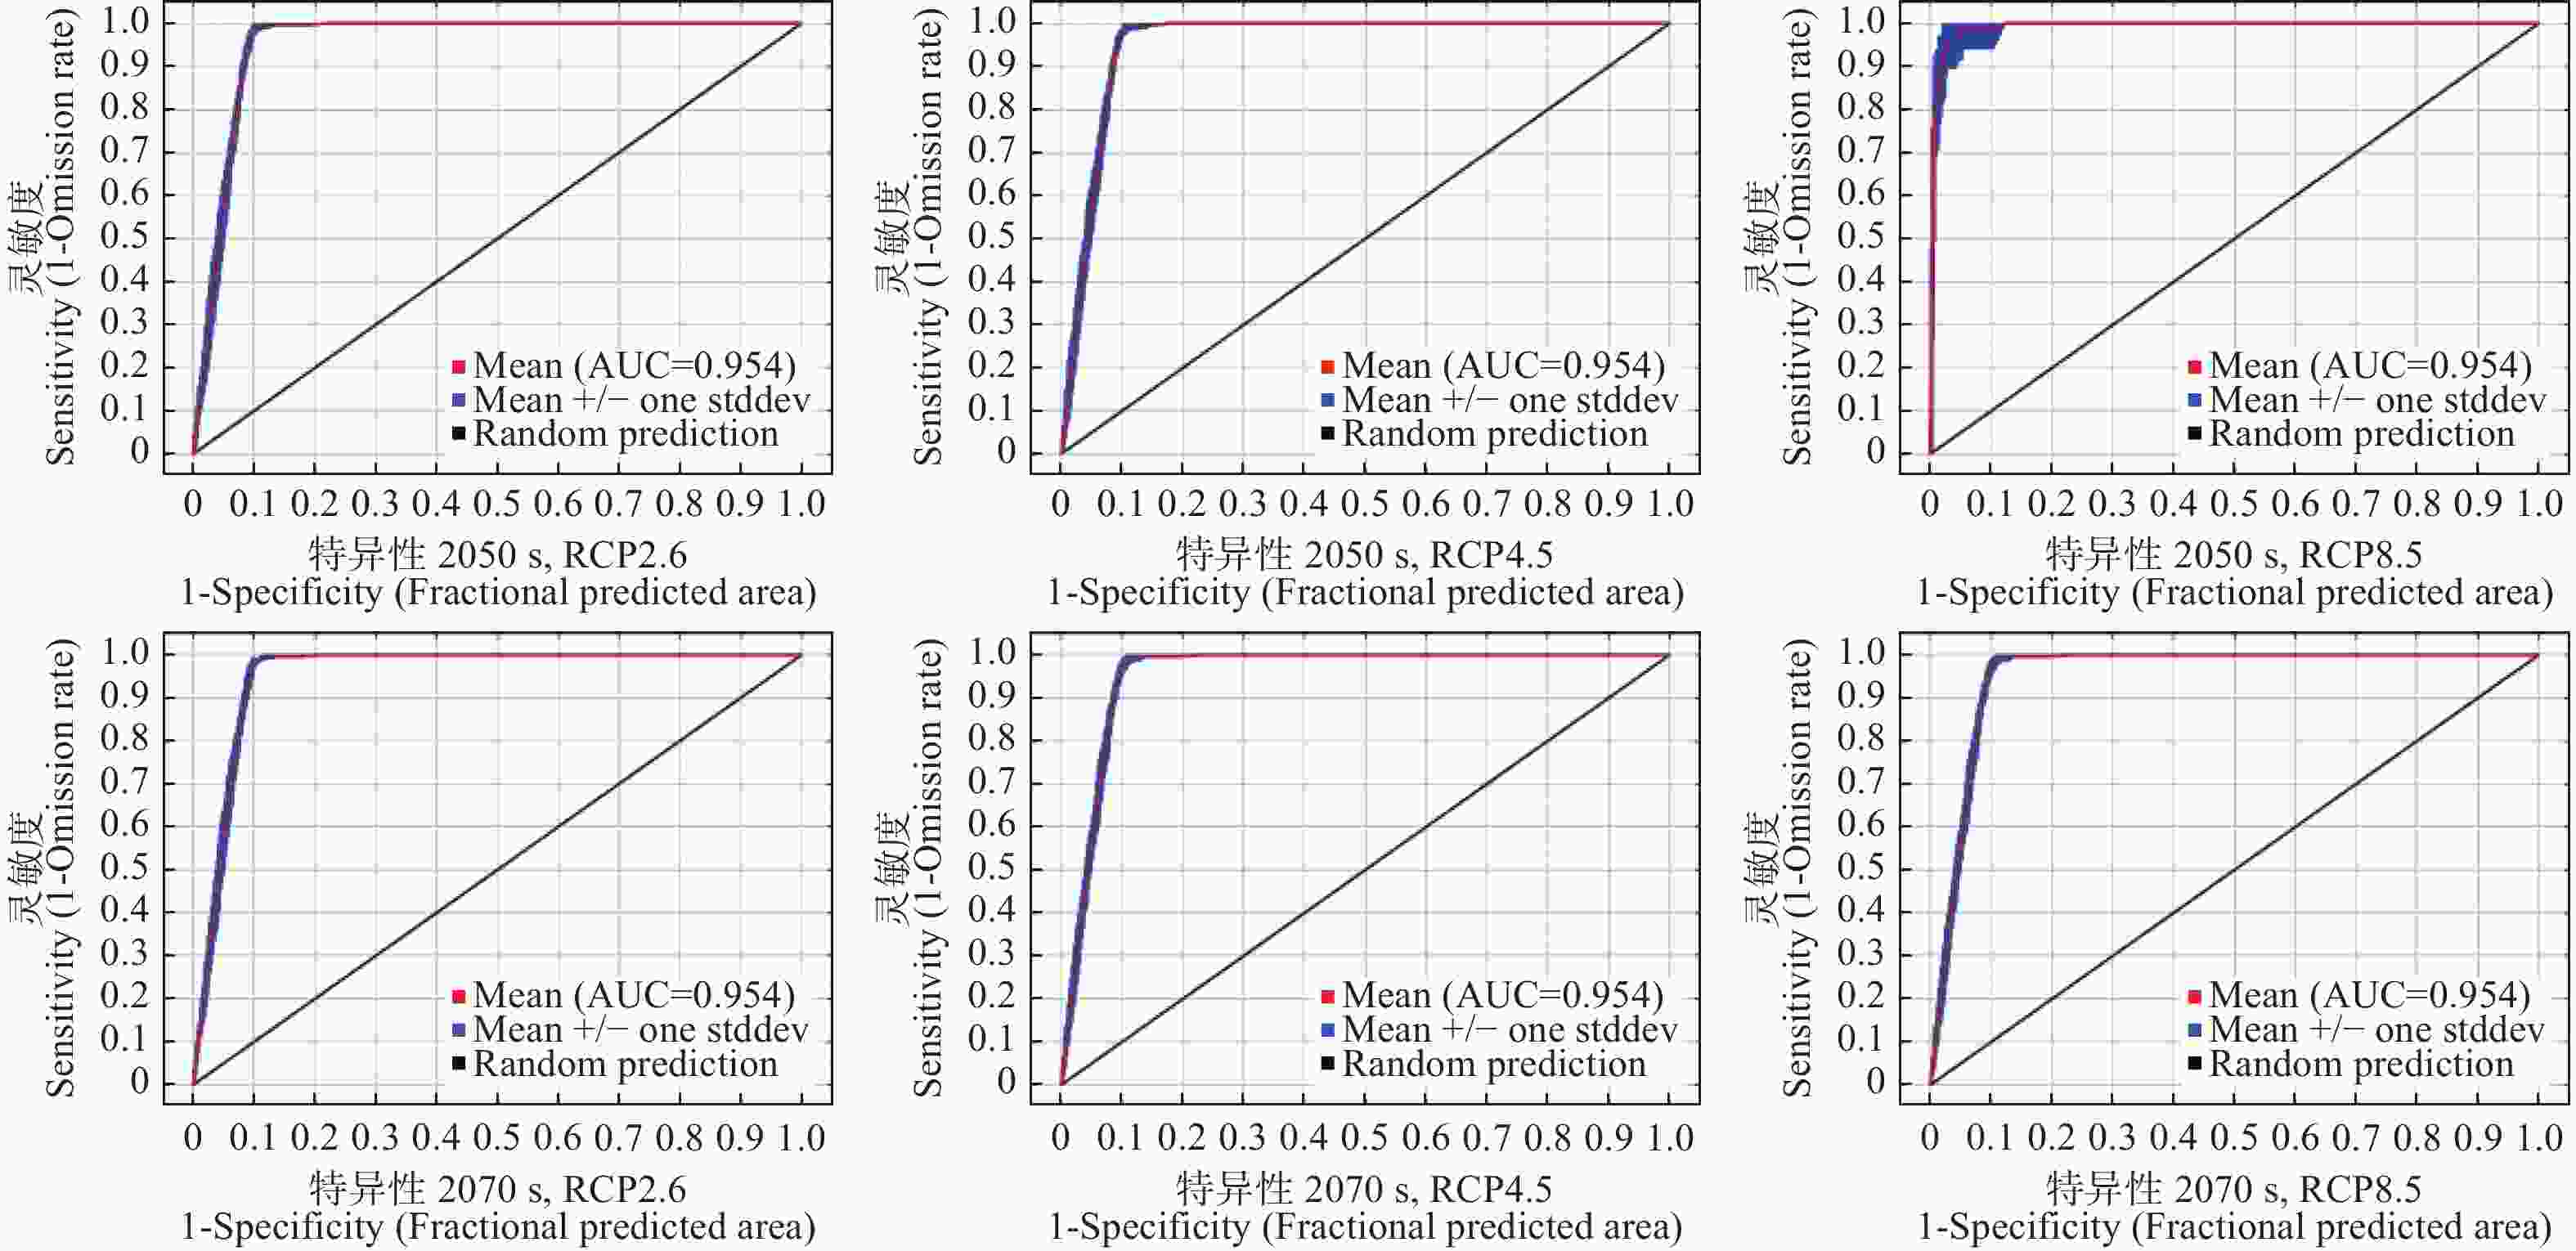
Figure 4. MaxEnt simulation results under different climate scenarios in the future
-
由统计分析(见表3)可知,当前松墨天牛在中国的适生区范围为90°~125°E,20°~41°N,位于亚热带、暖温带之间,由西向东呈连续分布,集中于我国东南部,总面积2.58×10⁶ km2,占国土面积的26.80%。其中,高适生区面积为1.67×10⁶ km2,占适生区总面积的64.70%,其主要分布于长江以南的绝大多数省份;中适生区面积为4.87×10⁵ km2,占适生区总面积的18.87%,其环绕于高适生区周边;低适生区面积为4.24×10⁵ km2,占适生区总面积的16.43%,包括辽宁、山东、河北等省份。
省份名称
Province非适生区
面积
unsuitable area(km2)<5%低适生区
面积
lowly suitable
area (km2)
5~33%中适生区
面积
moderately suitable area
(km2)33~67%高适生区
面积
highly suitable
area (km2)
≥67%总面积
Total
(km2)总适生
区面积
Total suitable area
(km2)占全国高适生
区百分比
Percentage of highly
suitable areas in China占全国总适生
区百分比
Percentage of
total suitable
areas in China黑龙江Heilongjiang 543697.92 0.00 0.00 0.00 543698 0.00 0.0000 0.000 内蒙古Inner Mongolia 1290607.66 0.00 0.00 0.00 1290608 0.00 0.0000 0.000 新疆Xinjiang 1755208.36 0.00 0.00 0.00 1755208 0.00 0.0000 0.000 吉林Jilin 210277.78 1857.64 329.86 0.00 212465 2188 0.0000 0.010 辽宁Liaoning 121267.36 0.0030746.53 3541.67 0.00 155556 34288 0.0000 0.220 甘肃Gansu 408628.48 4861.11 1510.42 243.06 415243 6615 0.00059 0.016 河北Hebei 158333.34 37864.58 277.78 0.00 196476 38142 0.0000 0.194 北京Beijing 9565.97 7673.61 0.00 0.00 17240 7674 0.0000 0.445 山西Shanxi 155503.47 4236.11 0.00 0.00 159740 4236 0.0000 0.267 天津Tianjin 3315.97 8767.36 0.00 0.00 12083 8767 0.0000 0.726 陕西Shaanxi 149392.36 30659.72 10468.75 13194.44 203715 54323 0.0648 0.267 宁夏Ningxia 52760.42 0.00 0.00 0.00 52760 0.00 0.0000 0.000 青海Qinghai 713211.82 17.36 0.00 0.00 713229 17.00 0.0000 0.00002 山东Shandong 37430.56 69878.47 37569.45 8298.61 153177 115747 0.0542 0.756 河南Henan 66458.33 51927.08 21232.64 21597.22 161215 94757 0.1340 1.658 江苏Jiangsu 399.31 0.00 26406.25 70364.58 97170 96771 0.7241 0.996 安徽Anhui 260.42 6197.92 39253.47 88090.28 133802 133542 0.6584 0.998 四川Sichuan 148194.45 58628.47 64809.03 183663.20 455295 307101 0.4033 0.675 湖北Hubei 2517.36 17135.42 19913.19 135885.42 175451 172934 0.7745 0.986 重庆Chongqing 0.00 468.75 694.44 76041.67 77205 77205 0.9849 1 上海Shanghai 0.00 312.50 3020.83 2309.03 5842 5642 0.4092 1 浙江Zhejiang 260.42 937.50 277.78 92378.47 93854 93594 0.9843 0.997 湖南Hunan 0.00 0.00 6961.80 186961.81 193942 193942 0.9641 1 江西Jiangxi 1215.28 2395.83 3645.83 145503.47 152760 151545 0.9525 0.992 云南Yunnan 25086.81 70538.20 190364.59 55729.17 314719 316632 0.1631 0.927 贵州Guizhou 0.00 0.00 260.42 159479.17 159749 159740 0.9984 1 福建Fujian 0.00 972.22 3628.47 104097.22 108698 108698 0.9577 1 广西Guangxi 0.00 0.00 6267.36 202569.45 208837 208837 0.9700 1 台湾Taiwan 16111.11 6440.97 8819.44 104.17 31476 15365 0.0033 0.488 广东Guangdong 17.36 86.81 35902.78 118593.75 154601 154583 0.767 1 香港Hongkong 0.00 0.00 937.50 0.00 938 938 0.0000 1 海南Hainan 16701.39 11423.61 520.83 0.00 28646 11944 0.0000 0.417 总(中国)Total (China) 5886423.71 393281.24 486614.58 1665104.19 8435398 2575767 0.1973 0.3054 Table 3. Prediction of potential suitable area of Monochamus alternatus under current climate conditions
选取2050s和2070s两个未来时段为, RCP2.6、RCP4.5和RCP8.5三种气候模式,上述情景下松墨天牛在研究区的高适生区仍主要集中在湖北、重庆、浙江、湖南、贵州等省,中适生区减少,逐渐发展为高适生区,其中包括四川、河南等省高适生区已覆盖大面积中适生区,西藏自治区东南部也开始逐渐出现高适生区。低适生区面积增加,向高纬度、高海拔地区扩增。在不同的时段和气候情景下,松墨天牛的分布范围和面积会有所差异。2050年RCP8.5总适生面积最大,低适生区面积增加最多,2070年RCP8.5高适生区面积最大(见表4)。
时间Decade 气候情景Climate scenarios 非适生区
Unsuitable area低适生区
Lowly suitable area中适生区
Moderately suitable area高适生区
Highly suitable area预测面积Predicted area(km2) 占总面积的比例Proportion of total area 预测面积Predicted area(km2) 占总面积的比例Proportion of total area 预测面积Predicted area(km2) 占总面积的比例Proportion of total area 预测面积Predicted area(km2) 占总面积的比例Proportion of total area 1950-2000 Current 5886424 0.6956 424028 0.0501 486615 0.0575 1665104 0.1968 2050s RCP2.6 5270122 0.6233 777882 0.0920 411128 0.0486 1995677 0.2360 RCP4.5 5326493 0.6300 791493 0.0936 333976 0.0395 2002847 0.2369 RCP8.5 5014757 0.5931 1081944 0.1280 448889 0.0531 1909219 0.2258 2070s RCP2.6 5261997 0.6224 743663 0.0880 482813 0.0571 1966337 0.2326 RCP4.5 5199861 0.6150 820417 0.0970 455035 0.0538 1979497 0.2341 RCP8.5 5239688 0.6197 717639 0.0849 427205 0.0505 2070278 0.2449 Table 4. Predicted areas for Monochamus alternatus under current and future climate conditions
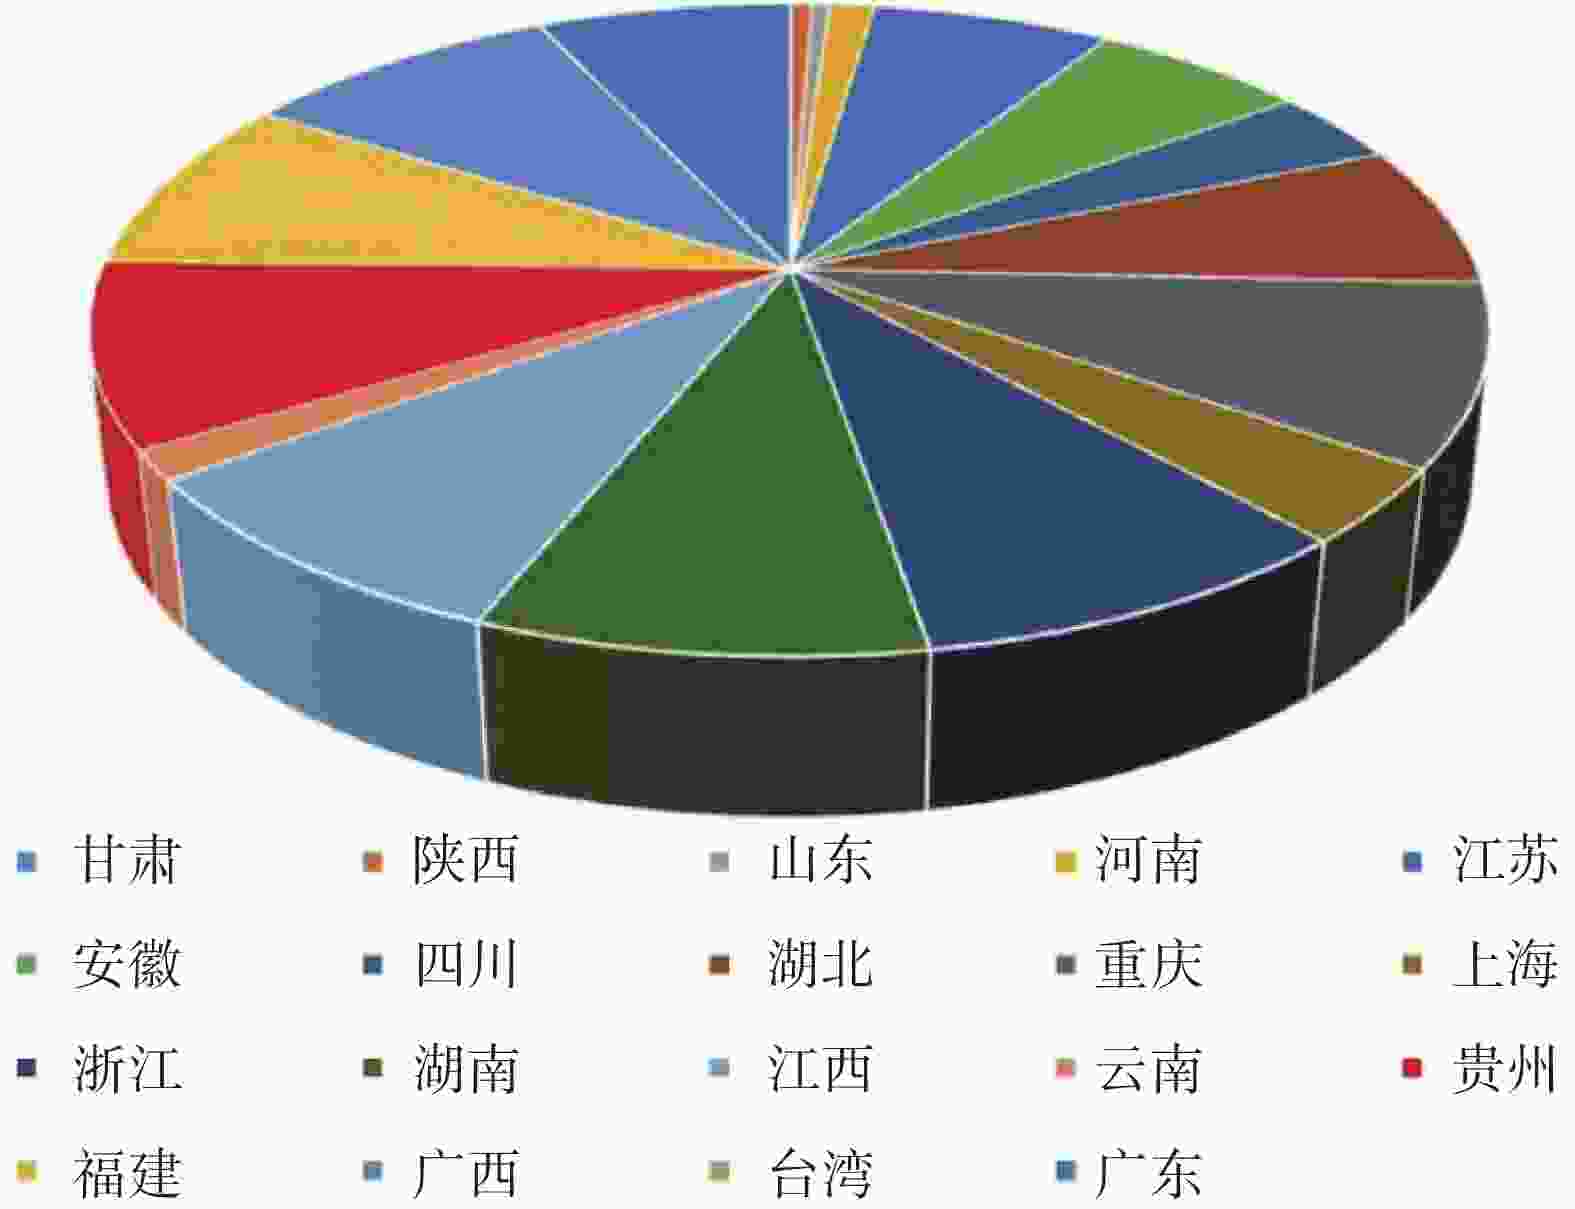
Figure 5. Distribution of high suitable area of Monochamus alternatus
-
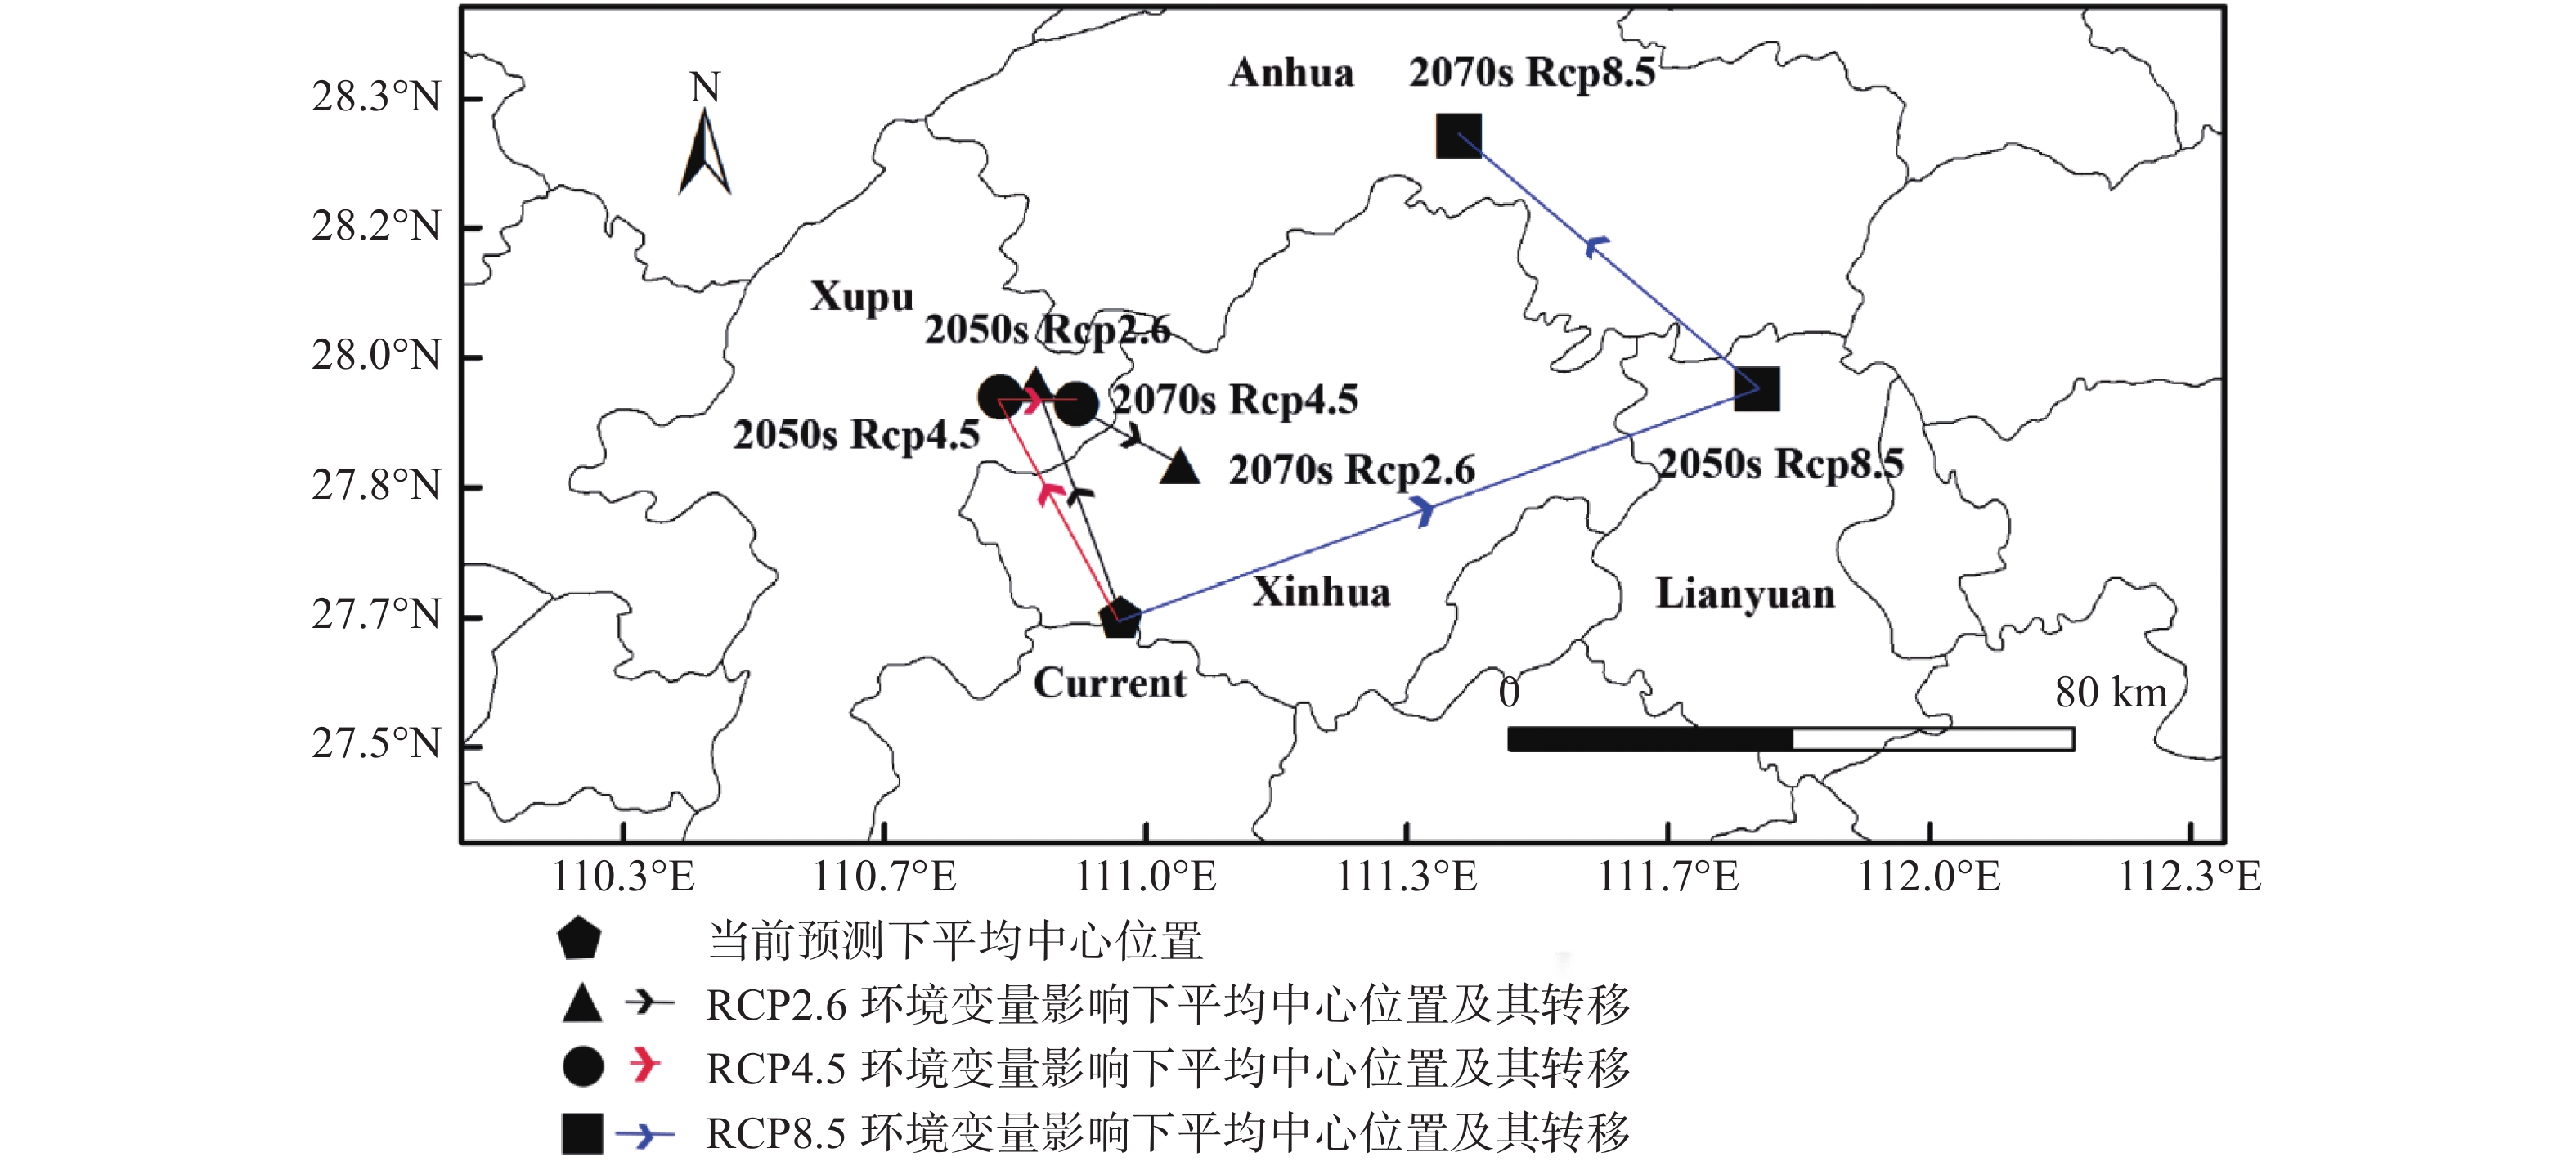
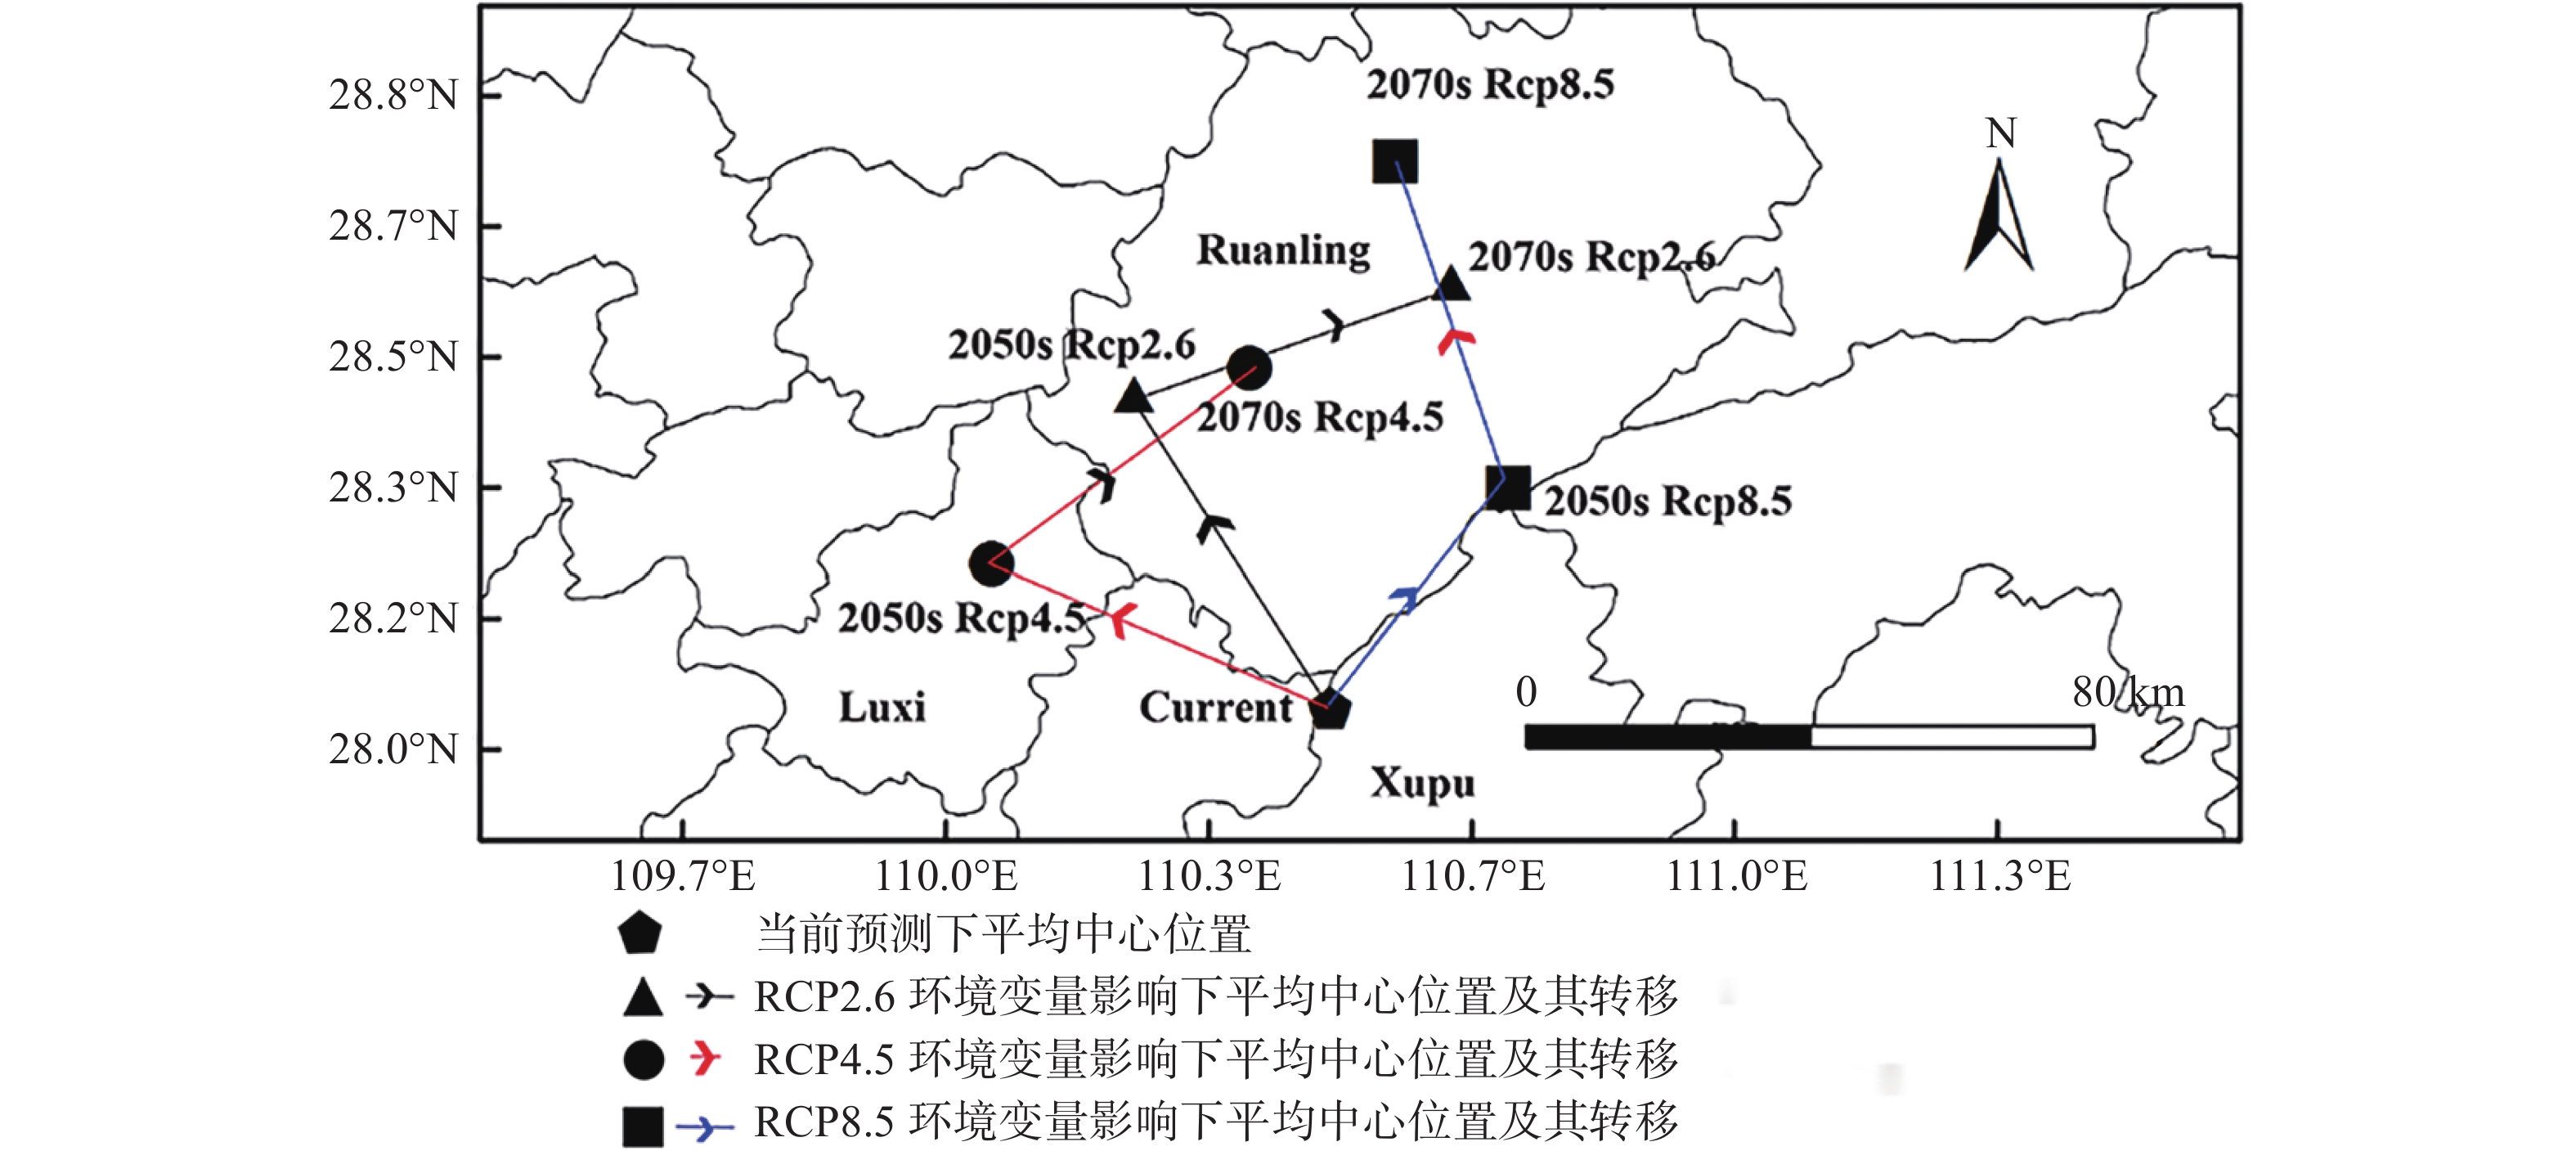
根据研究结果显示,在当前及RCP2.6情景下,松墨天牛高适生区面积呈先增后减的趋势。其面积从当前的1.67×10⁶ km2增加至2070s的1.97×10⁶ km2;总适生面积持续增加,从2.58×10⁶ km2增加到2070s的3.19×10⁶ km2(见表4) 。当前至2070s,高适生区中心点由湖南新化(当前) 经湖南怀化(2050) 位移回湖南新化 (2070s) (见图6) ;总适生区中心点由湖南溆浦(当前) 位移至湖南沅陵(2050、2070s) (见图7)。
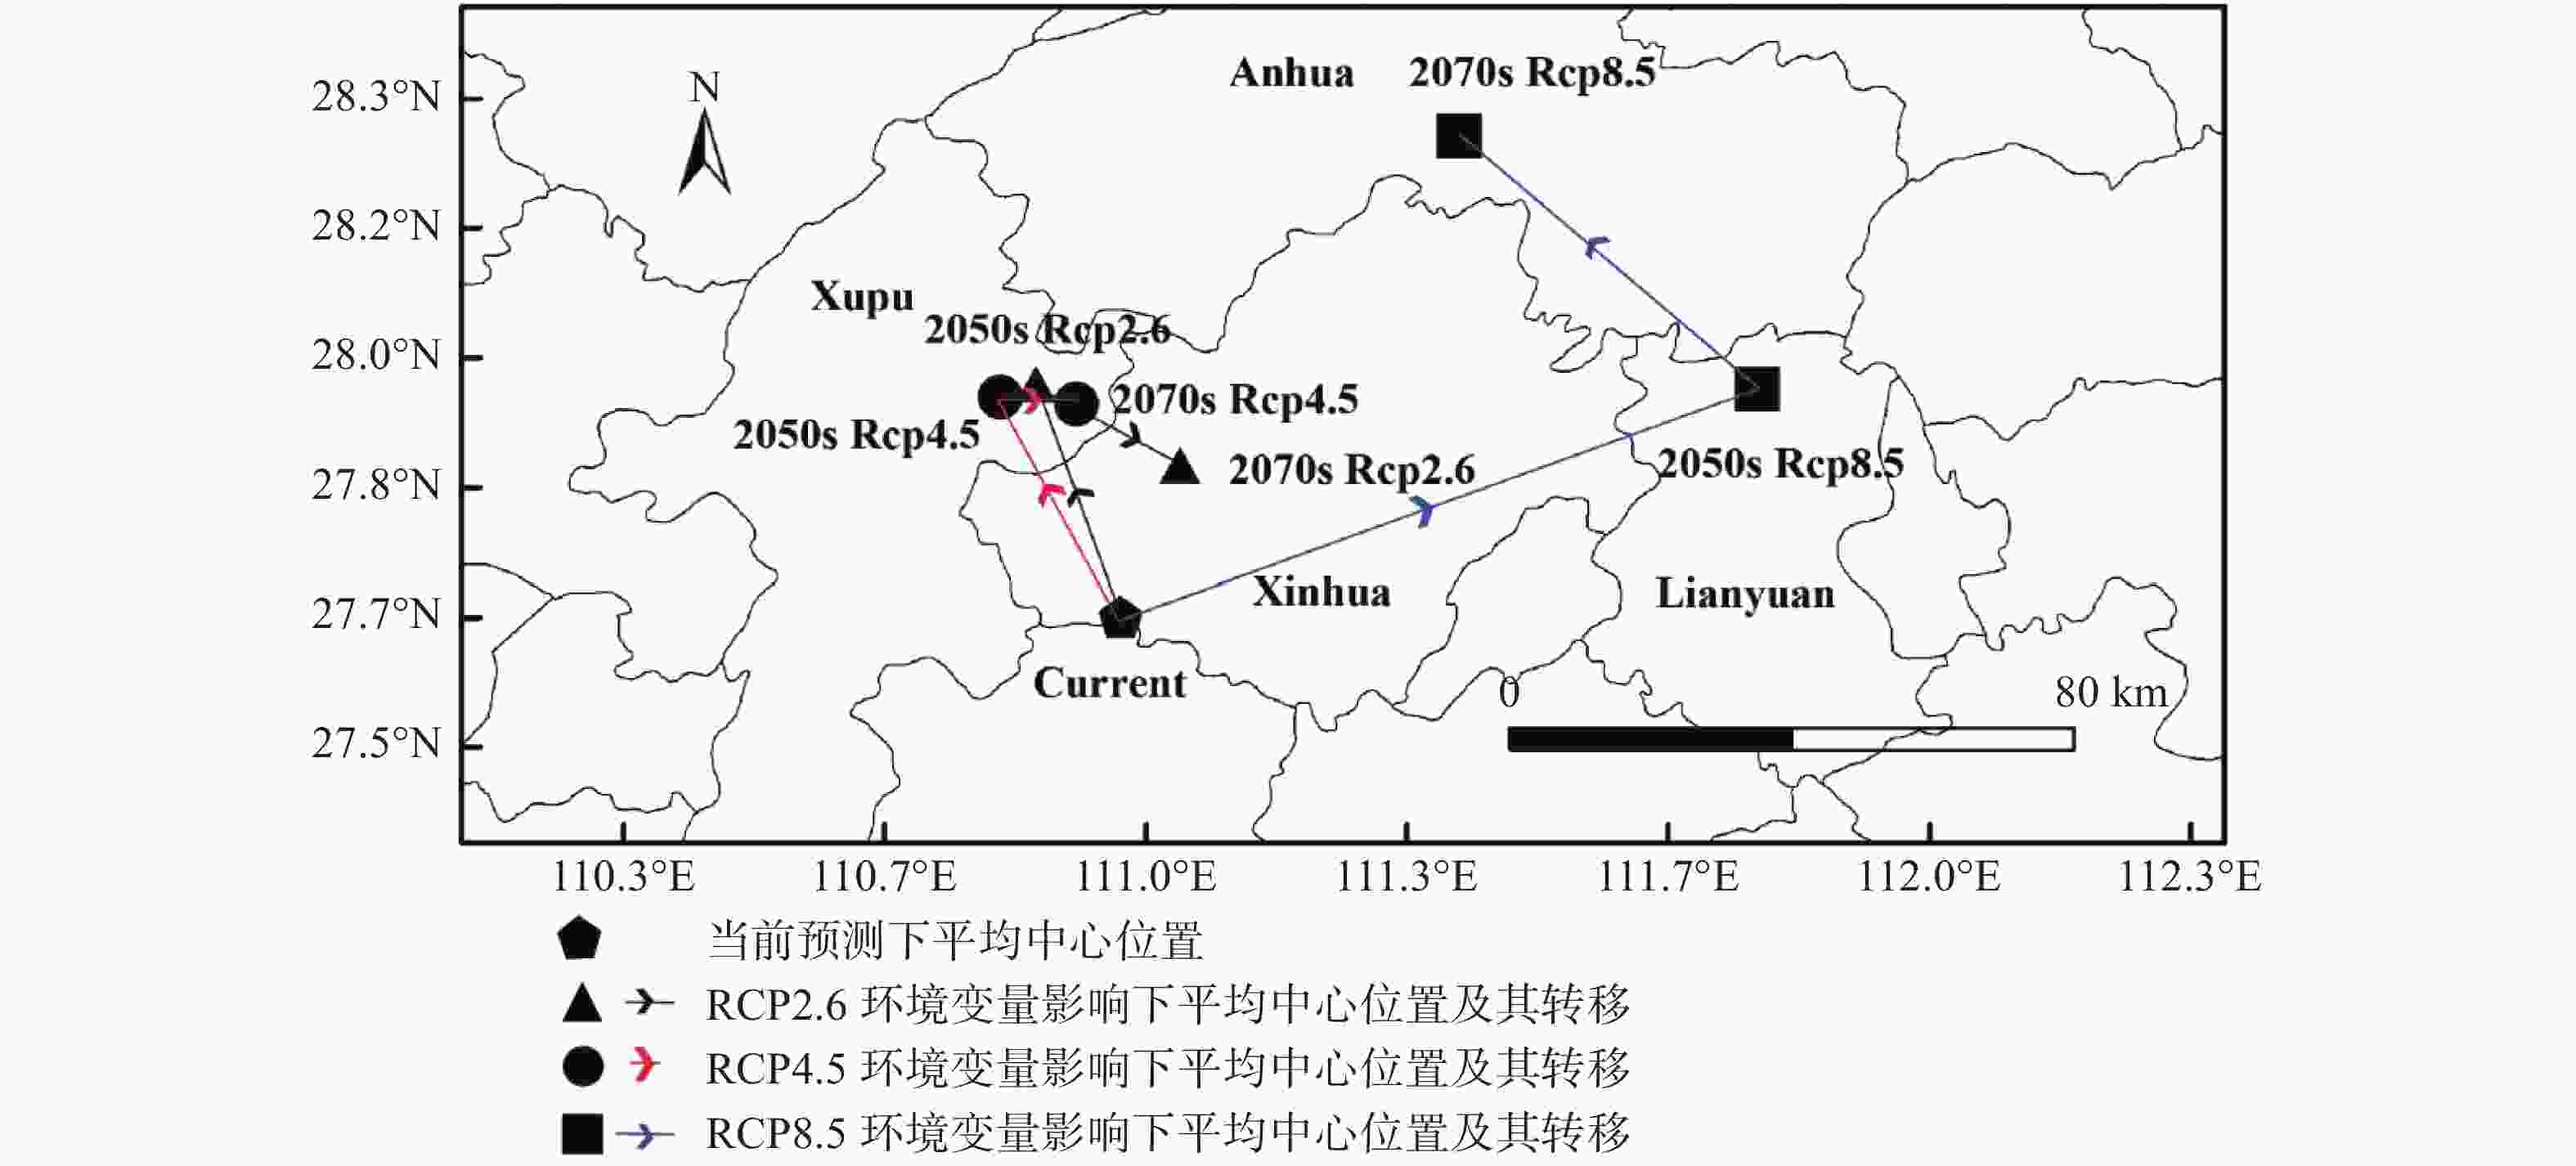
Figure 6. The location and migration of mean center of high suitable area of Monochamus alternatus under different climate change scenarios
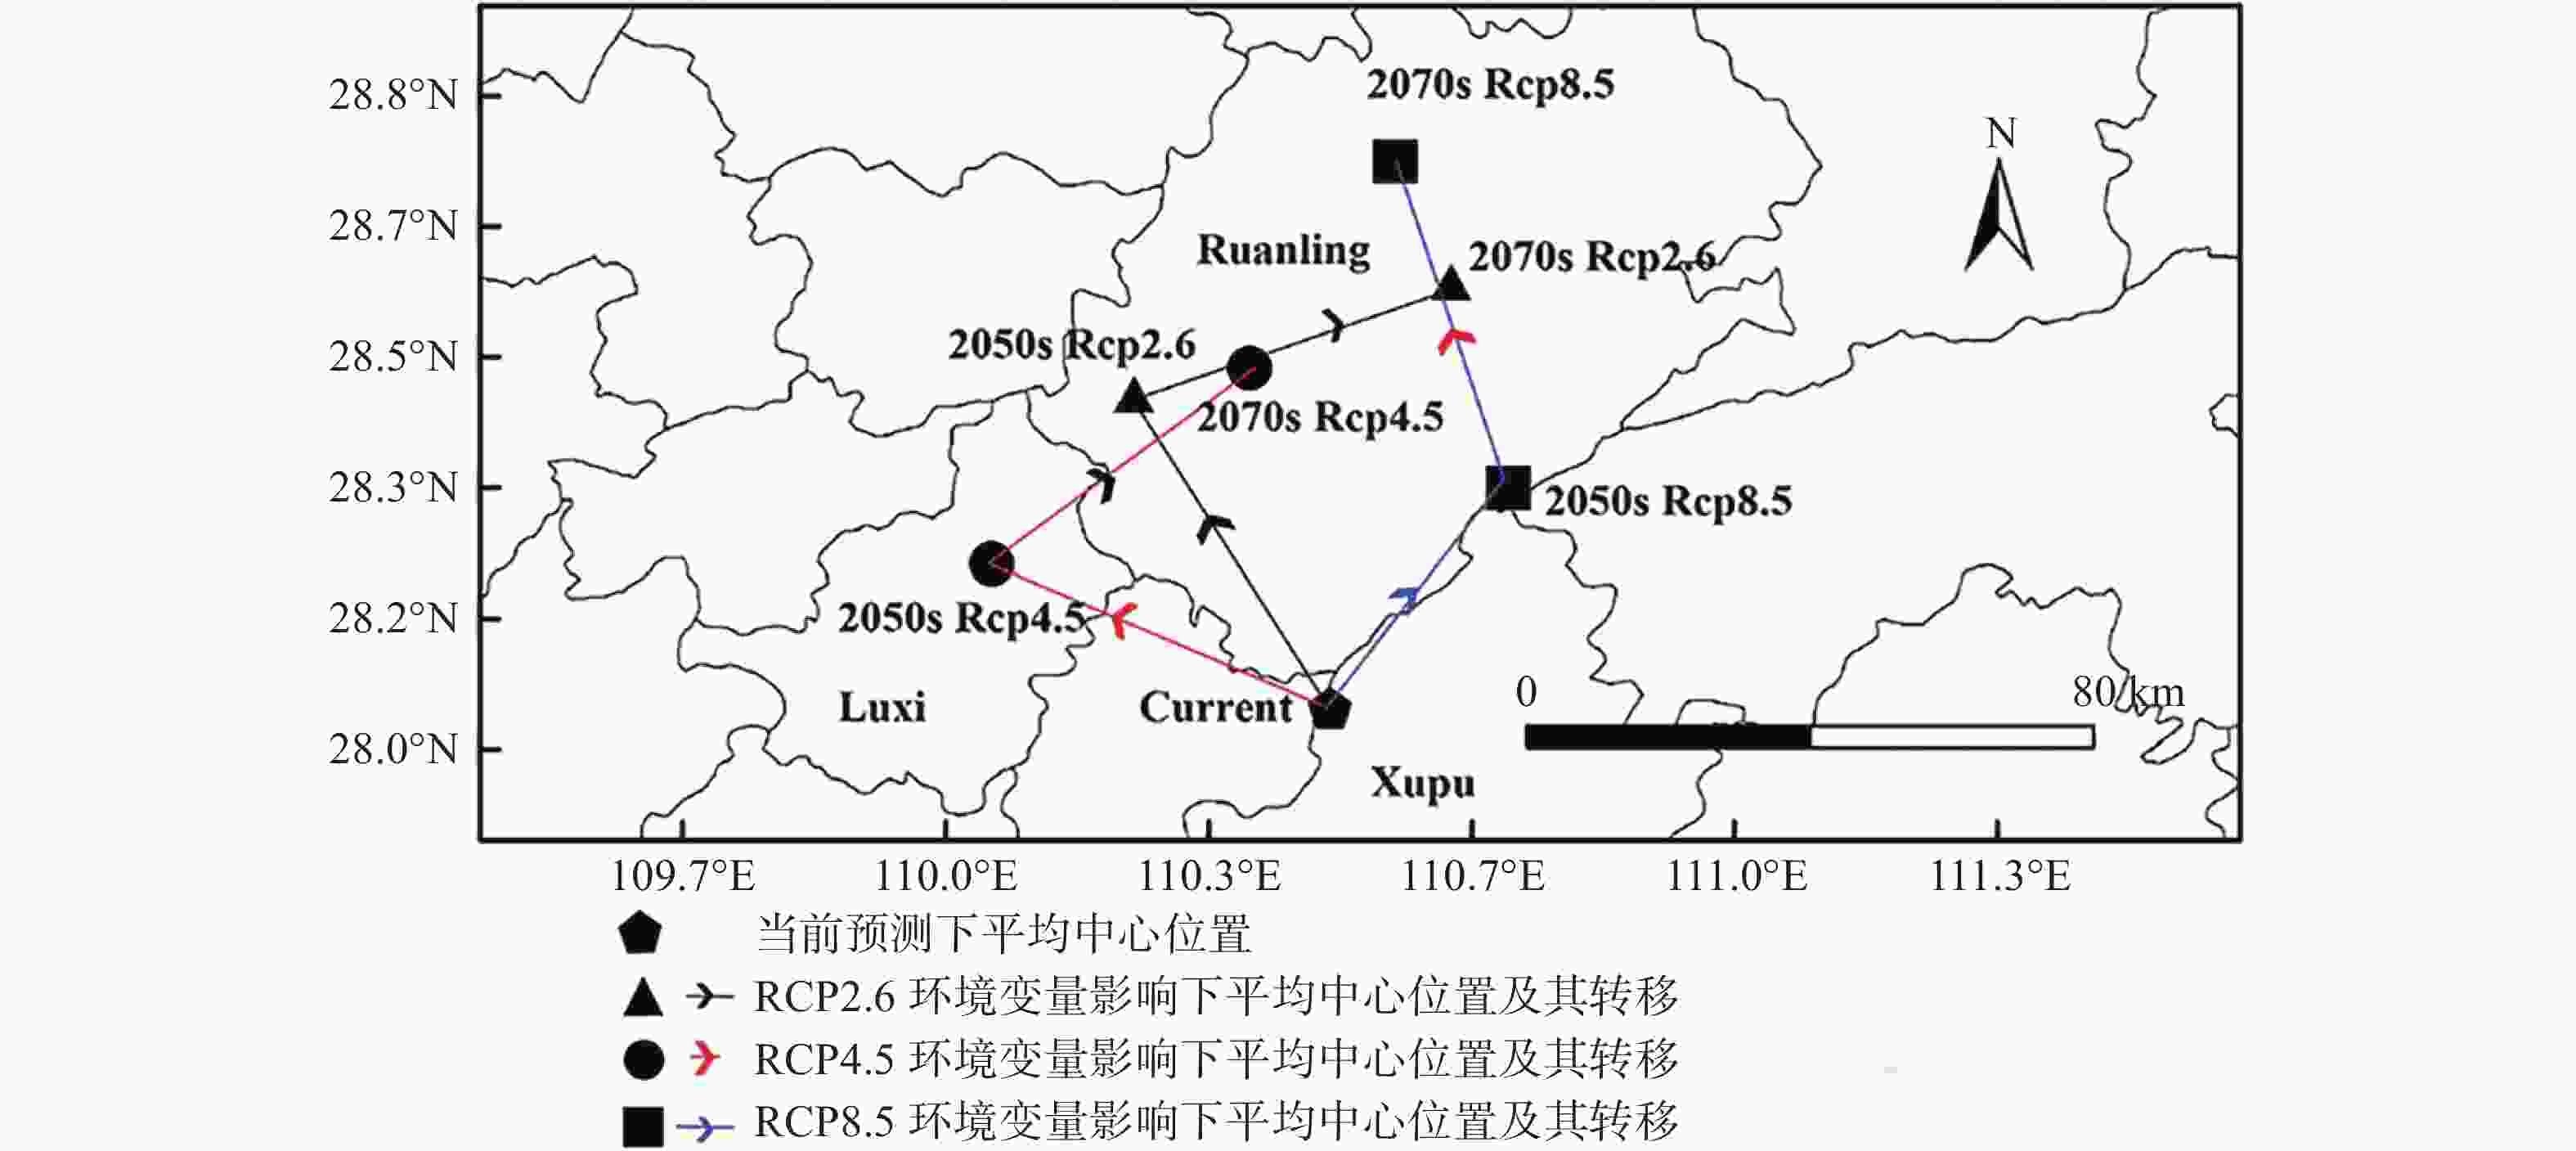
Figure 7. The location and migration of mean center of totally suitable areas of Monochamus alternatus under different climate change scenarios
研究结果显示,在当前及RCP4.5情景下,松墨天牛高适生区面积呈先增后减的趋势。面积从当前的1.67×10⁶ km2增加至2070s的1.98×10⁶ km2;总适生面积持续增加,从2.58×10⁶ km2增加至2070s的3.25×10⁶ km2(见表4) 。当前至2070s, 高适生区中心点由湖南新化(当前)位移至湖南溆浦(2050、2070s)(见图6) ;总适生区中心点由湖南溆浦(当前) 经湖南泸溪(2050s)位移至湖南沅陵(2070s)(见图7)。
当前及RCP8.5情景下,其高适生区面积呈持续增加趋势,由当前的1.67×10⁶ km2增加至2070s的2.07×10⁶ km2;总适生面积呈现先增后减趋势,由2.58×10⁶ km2增加至2070s的3.22×10⁶ km2(见表4)。当前至2070s, 高适生区中心点由湖南新化(当前)经湖南涟源(2050s)位移至湖南安化(2070s) (见图6);总适生区中心点由湖南溆浦(当前,2050s) 位移至湖南沅陵(2070s)(见图7)。
-
MaxEnt软件基于最大熵原理,以物种分布变量和环境变量为基础,对约束条件下可能的最大熵分布进行统计分析[42]。AUC值表示了不同试验的准确度,并且不受发病率和诊断阈值的影响[43]。根据研究结果,无论是在当前的气候模式下还是未来的气候模式下,对松墨天牛适生区的预测AUC值均超过0.95,这意味着松墨天牛的实际分布与模型预测的地理分布之间具有较高的拟合度,可以利用这些预测结果来进行松墨天牛在中国地理分布与气候关系的研究。根据Maxent结果显示,当前松墨天牛在中国的适生区在90°~125°E ,20°~41°N的亚热带、暖温带之间,分布于华东、华南地区。刀切法检验结果显示,影响松墨天牛适生区分布的决定条件是最暖季降雨量(bio18),适生范围500~1000 mm,这与夏季( 尤其是6—7月) 为松墨天牛普遍的盛发期有关,当最暖季降雨量小于550 mm时,湿度可能最适宜,松墨天牛的羽化率大[44-45];当降雨量超过550 mm时,成虫出孔数减少[46-47]。气候变暖对昆虫的发育、繁殖、物候发生期、种群丰富度、寄主植物等核心生命活动产生直接影响[3-6,48]。气象因子中温度和降水是决定病虫害空间格局的主要因素,对松墨天牛的发生与分布有显著的影响,其变化范围与病虫害潜在的空间格局有十分密切的关系[49]。高适生区和总适生区在中国的中心点均分布于湖南省北部,且在未来气候变化情境下的迁移趋势一致。位移方向为东北、西北方向,即向高纬度、高海拔方向位移,与Maxent模型预测得到的适宜分布图直观观测的变化结果相一致,同时与其他相关研究得到的全球气候变暖会引起物种向高海拔和高纬度迁移的结论相一致[50-51]。迁移趋势均在高浓度排放情景下 (RCP 8.5) 响应最为剧烈,这是因为气候变暖导致昆虫地理分布向高纬度、高海拔地区扩散[8]。王庆运用低温冰冻雪指数K法研究发现,极端的低温冰冻雨雪气候对松墨天牛的发生有促进作用[52]。
气候是决定地球上物种分布的最主要因素,而物种分布格局的变化则是对气候变化最明确和直接地反映。在全球气候变化日益加剧的背景下,利用MaxEnt模型,结合GIS技术,预测物种适生分布区的空间变化和迁移趋势已成为虫害防治的关键问题,将为虫害综合治理提供重要的科学支持。
Potential distribution of Monochamus alternatus Hope (Coleoptera: Cerambycidae) in China based on MaxEnt model and its response to climate change
doi: 10.12172/202306120001
- Received Date: 2023-06-12
- Available Online: 2023-11-30
- Publish Date: 2024-04-25
-
Key words:
- Monochamus alternatus Hope /
- MaxEnt /
- global warming /
- suitable area /
- mean point migration
Abstract: Due to the global warming, the spatial distribution pattern of pests has changed greatly, which increases the difficulty of pest prevention. In this paper, using MaxEnt model and GIS method, the potential suitable distribution area of Monochamus alternatus in China was simulated. At the same time, the distribution range and spatial arrangement in three climate scenarios (RCP2.6, RCP4.5 and RCP8.5), and the movement law of its mean center were predicted, compared and analyzed. The results showed that all AUC values were over 0.95, and the accuracy was in an "excellent" state. Under current conditions, the suitable range of Monochamus alternatus in China was 20-41°N, 90-125°E, which was distributed continuously from west to east and concentrated in the southeast of China. Under future climate scenarios, the moderately suitable area will decrease, while the lwo and high suitable areas will increase, and will spread to the high latitude and altitude areas, with RCP8.5 having the largest diffusion range. The mean center of the suitable area predicted to move northwest or northeast under different scenarios, and the migration trend was the most intense in the highest greenhouse gas emission scenario (RCP8.5). The results provide an effective means for rational zoning of Monochamus alternatus and a theoretical basis for coping with climate warming.


 DownLoad: