


-
树高与胸径是描述林木生长状况的主要调查因子,他们之间往往存在正相关的相关关系[1-3]。林分是指林木的内部结构特征[4],林分优势木平均高是反映林分状态重要指标,他是最稳定的调查因子之一[5-6]。现地调查可以准确测量出林分优势木平均高,但相较于胸径,树高的测量难度更大[7]。通过胸径来推算树高在一定程度上为林业调查提供了便利[8-10]。
目前,多数树高—胸径模型的构建多是围绕林木开展[11-13],以林分为研究对象的较少。树高胸径的相关关系在不同树种之间也会存在差异[14-16]。传统的回归模型在复杂的计算中不适用,林分优势木平均高—平均胸径之间的相关关系受多种因素的影响使其不再是一个简单的变化,使用传统回归模型来预测林分优势木平均高,其结果可能是有偏的[17-19]。随着数学、统计学软件的发展,混合效应模型逐渐被应用于林业领域[20-21],混合效应模型应用于重复测量数据时,在考虑固定效应的同时考虑了随机效应,不仅能描述数据整体的变化规律,还能反映数据之间的变化,估计结果时更为准确 [22]。
通过会理市“二调”数据分析,选择树种面积占木材树种面积之比最多的5个乔木树种(云南松54.0%,其他硬阔12.2%,桤木11.6%,栎类6.5%,华山松3.3%)为研究对象,布设123块样地,通过模型拟合来研究林分优势木平均高—平均胸径的相关关系,以期为类似林分的优势木平均高的估算提供参考。
-
研究区位于会理市,东经101°52′~102°38′,北纬26°5′~27°12′,属中亚热带西部半湿润气候区,阳光照射充足,年均日照2400h,年均气温15.1℃,有丰富的光热资源,蒸发旺盛;雨量集中,干湿季分明;气温年较差小,日较差大;冬暖无严寒,夏凉无酷暑;气候垂直变化大,高山积雪、峡谷炎热;气温回升和下降波动大。
-
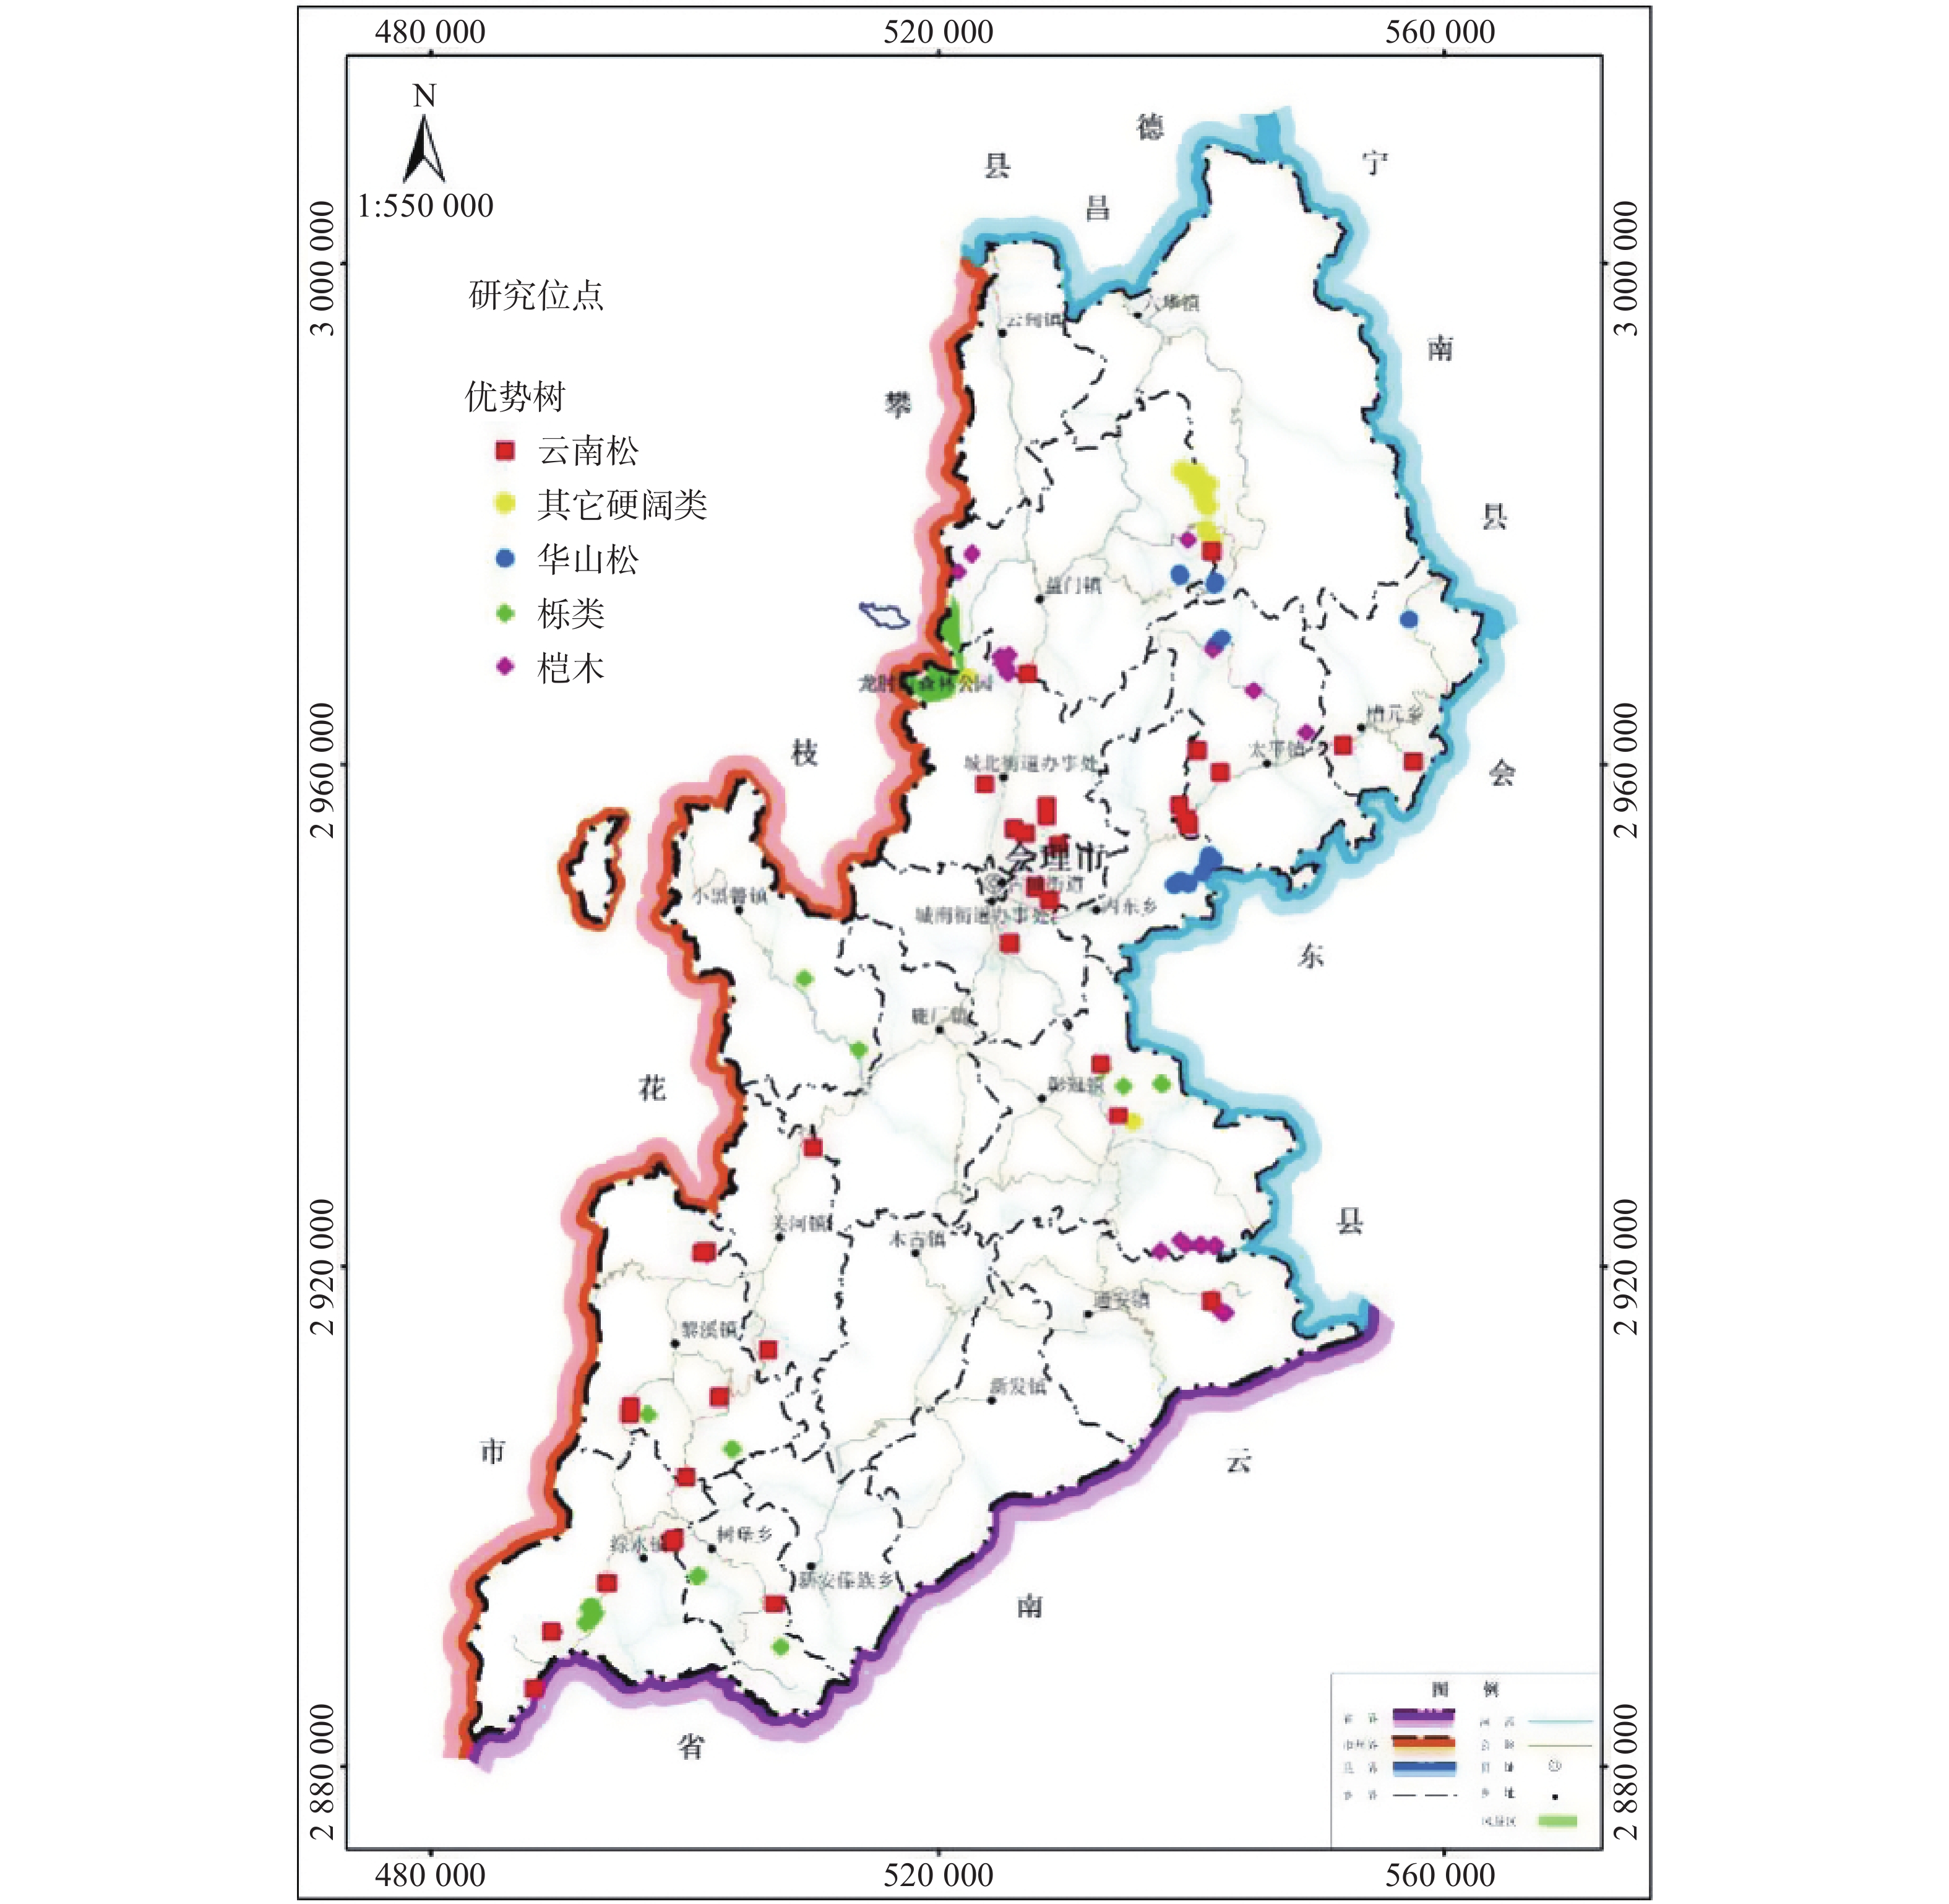
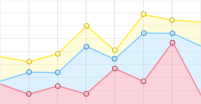
5个主要树种分布范围内布设实测样地,样地为方形,面积666.7m2(见图1),各样地点位基本信息见表1,林分优势木平均高(算术平均高)和平均胸径(算术平均胸径)因子统计结果见表2。
Figure 1. Schematic diagram of sample plots layout position
树种 海拔 林分密度 郁闭度 地貌 起源 Plant Heiht Stand density Canopy closure Landforms Origin 云南松(n=43) 1772—2947 45—2685 0.2—0.85 中山 人工、天然 Pinus yunnanensis 其他硬阔(n=21) 1861—3105 120—3720 0.3—0.8 中山、高山 天然 softwood 华山松(n=14) 2396—2749 735—2265 0.6—0.8 中山 人工 Pinus armandi 栎类(n=20) 1724—3103 495—4095 0.25—0.7 中山 天然 Quercus sp. 桤木(n=25) 2161—2619 255—1455 0.2—0.75 中山 人工、天然 Alnus cremastogyne Table 1. Basic information of various sample plots
树种
Plant优势木平均高(H)/ m
Average Height of dominant wood优势木平均胸径(DBH)/ cm
Average DBH of dominant trees最小值
MIN最大值
MAX均值标准误
SEM最小值
MIX最大值
MAX均值标准误
SEM合计(n=123)
Total5.1 24.5 0.3840 2.2 15.9 0.2961 云南松(n=43) 5.8 20.3 0.4706 2.2 14.5 0.4701 其他硬阔(n=21) 5.1 23.6 0.8985 3.4 15.9 0.7748 华山松(n=14) 10.1 21.4 0.7961 9 14.6 0.4851 栎类(n=20) 5.5 24.5 1.1299 3.3 12.1 0.6597 桤木(n=25) 6.8 23.1 0.9979 5.5 14.5 0.6283 Table 2. Statistical investigation results of various tree species
-
采用常见的5个函数模型,通过IBM SPSS Statistics的曲线估计来构建林分优势木平均高—平均胸径模型,各模型表达式如下:
线性:
$ H=\beta 1\times DBH $ 二次函数:
$ H=\beta 1\times {DBH}^{2}+\beta 2\times DBH $ 三次函数:
$ H=\beta 1\times {DBH}^{3}+\beta 2\times {DBH}^{2}+\beta 3\times DBH $ 幂函数:
$ H={DBH}^{\beta 1} $ 对数函数:
$ H=\beta 1\times \mathrm{ln}DBH $ 式中:
$ H $ 为林分优势木平均高、$ DBH $ 为林分优势木平均胸径,$ \beta 1、\beta 2、\beta 3 $ 为估计参数。模型评估通过决定系数
$ {R}^{2} $ 进行评价。$ {R}^{2} $ 越大,模型拟合效果越好。式中:
$ {H}_{i} $ 为林分优势木平均高实际值,$ {\widehat{H}}_{i} $ 、$ {\overline{H}}_{i} $ 分别为预测值和平均值。 -
以全部样地为研究对象,分别以线性、对数函数、二次函数、三次函数、幂函数来构建林分优势木平均高—平均胸径模型,选择决定系数最高的模型作为基础模型,加入随机效应参数,构建林分优势木平均高—平均胸径混合效应模型。
混合效应模型的拟合精度以赤池信息准则
$ \mathrm{A}\mathrm{I}\mathrm{C} $ 、贝叶斯信息准则$ \mathrm{B}\mathrm{I}\mathrm{C} $ 两个指标进行评价。赤池信息准则:
$ \mathrm{A}\mathrm{I}\mathrm{C}=-2\mathrm{ln}L({\widehat{\theta }}_{L},x)+2q $ 贝叶斯信息准则:
$ \mathrm{B}\mathrm{I}\mathrm{C}=-2\mathrm{ln}L({\widehat{\theta }}_{L},x)+q\mathrm{log}n $ 式中:
$ {\widehat{\theta }}_{L} $ 为模型的似然函数中$ L({\widehat{\theta }}_{L},x) $ 的$ \theta $ 极大似然估计值,$ x $ 为随机样本,$ q $ 为未知参数个数,$ n $ 为观测个数。 -
从表3可以看出,从不同函数来看,5个函数模型均能较好地拟合林分优势木平均高—平均胸径模型,各树种拟合的
$ {R}^{2} $ 均在0.879以上,幂函数模型表现最好。对数函数、线性函数在拟合林分优势木平均高—平均胸径时表现较差;从不同树种来看,华山松林分优势木平均高—平均胸径模型拟合精度最高,其中,华山松林分幂函数模型的$ {R}^{2} $ 最高,达0.997,栎类林分优势木平均高—平均胸径模型拟合精度最低,其中栎类林分对数模型的$ {R}^{2} $ 最低,仅有0.879。各树种林分优势木平均高与平均胸径的相关关系均为极显著,最优模型拟合结果见表4。方程Equation 决定系数$ {R}^{2} $ 云南松 其他硬阔 华山松 栎类 桤木 线性 linear 0.937− 0.956− 0.980 0.914 0.965 对数logarithm 0.964 0.956− 0.976− 0.879− 0.932− 二次Quadratic 0.960 0.965 0.980 0.915 0.966 三次Cubic 0.968 0.972 0.980 0.946 0.970 幂Power 0.978* 0.986* 0.997* 0.984* 0.993* 注“*”表示该模型在对应树种的拟合效果最好,“-” 表示该模型在对应树种的拟合效果最差。
Note: "*" indicates that the model has the best fitting effect in the corresponding tree species, and "-" indicates that the model has the worst fitting effect in the corresponding tree species.Table 3. Fitting results of average height and average DBH model of dominant trees in forest stands
方程Equation 模型摘要Model Summary 参数估算值Parameter estimate
$ \beta 1 $最优模型 R2 F 显著性 云南松(n=43) 幂函数 0.978 1862.324 0.000** 1.170 其他硬阔(n=21) 幂函数 0.986 1374.191 0.000** 1.168 华山松(n=14) 幂函数 0.997 4449.449 0.000** 1.103 栎类(n=20) 幂函数 0.984 1147.38 0.000** 1.135 桤木(n=25) 幂函数 0.993 3552.493 0.000** 1.114 注“**”表示该林分优势木平均高与平均胸径的显著性为极显著。
Note: "* *" indicates that the significance of average height and average DBH of dominant trees in this stand is extremely significant.Table 4. Average height and average DBH model of dominant trees in the best stands of each tree species
-
(1)基础模型选型
从表5可以看出,幂函数模型的
$ {R}^{2} $ 最高,拟合效果最好,故选择幂函数模型作为基础模型来构建混合效应模型。方程Equation 模型摘要Model Summary 参数估算值Parameter estimate R2 F 显著性 $ \beta 1 $ $ \beta 2 $ $ \beta 3 $ 线性linear 0.951 2383.34 0.000** 1.322 对数logarithm 0.945 2077.758 0.000** 5.686 二次Quadratic 0.955 1270.407 0.000** 1.599 −0.026 三次Cubic 0.959 943.807 0.000** 2.549 −0.232 0.01 幂Power 0.985 8262.119 0.000** 1.142 Table 5. Parameter estimation and model evaluation of average height and average DBH of dominant trees in forest stands
(2)混合效应模型构建
从表6可以看出,将参数
$ \beta 1 $ 作为混合参数时,$ \mathrm{A}\mathrm{I}\mathrm{C} $ 、$ \mathrm{B}\mathrm{I}\mathrm{C} $ 大于不考虑混合参数的基本模型,即将$ \beta 1 $ 作为混合参数不能提高模型的拟合精度。将$ \beta 2 $ 作为混合参数,或者将$ \beta 1、\beta 2 $ 同时作为混合参数时,$ \mathrm{A}\mathrm{I}\mathrm{C} $ 、$ \mathrm{B}\mathrm{I}\mathrm{C} $ 均小于不考虑混合参数的基本模型,模型拟合效果更好。在考虑随机效应的混合效应模型中,参数$ \beta 2 $ 作为混合参数时,模型的拟合效果最好。则混合效应模型 表达式如下:序号No. 混合参数 Mixed parameter 赤池信息准则 AIC 贝叶斯信息准则 BIC 1 无No 605.836 619.339 2 $ \beta 1 $ 614.841 640.899 3 $ \beta 2 $ 591.520 607.613 4 $ \beta 1、\beta 2 $ 603.189 631.633 Table 6. Evaluation of Mixed Effect Model of average height and average DBH of dominant trees in forest stands
混合模型:
$ H={DBH}^{\beta 1}+{\beta 2}' $ 式中:
$ H $ 为林分优势木s、$ DBH $ 为林分优势木平均胸径,$ \beta 1 $ 为固定效应参数,$ {\beta 2}^{\text{'}} $ 为包含截距随机效应的混合参数。(3)混合效应模型优化
混合效应模型考虑不同的协方差结构,可以提高模型的拟合精度,选用方差成分、对角以及复合对称来考虑模型的协方差结构来优化混合效模型,从表7可以看出,使用复合对称的方差结构来参与模型拟合,
$ \mathrm{A}\mathrm{I}\mathrm{C} $ 、$ \mathrm{B}\mathrm{I}\mathrm{C} $ 最小,模型效果最优。最优模型拟合结果见表8。序号No 协方差结构Covariance 赤池信息准则$ \mathrm{A}\mathrm{I}\mathrm{C} $ 贝叶斯信息准则$ \mathrm{B}\mathrm{I}\mathrm{C} $ 1 无No 591.520 607.613 2 对角矩阵Diagonalmatrix 591.520 607.613 3 复合对称矩阵Compound symmetric matrix 591.388 599.546 Table 7. Evaluation of Mixed Effect Model of average height and average DBH of dominant trees in forest stands
固定系数$ \beta 1 $ 随机效应$ {\beta 2}' $ 赤池信息准则$ \mathrm{A}\mathrm{I}\mathrm{C} $ 贝叶斯信息准则$ \mathrm{B}\mathrm{I}\mathrm{C} $ 模型Model 系数 标准误差 t 估算 标准误差 Z 基础模型
Ordinary model1.319 0.0257 51.385 605.836 619.339 最优混合模型
Mixed model1.060 0.0682 15.554 6.804 10.182 0.668 591.388 599.546 Table 8. Fitting results of Mixed Effect Model of average height and average DBH of dominant trees in forest stands
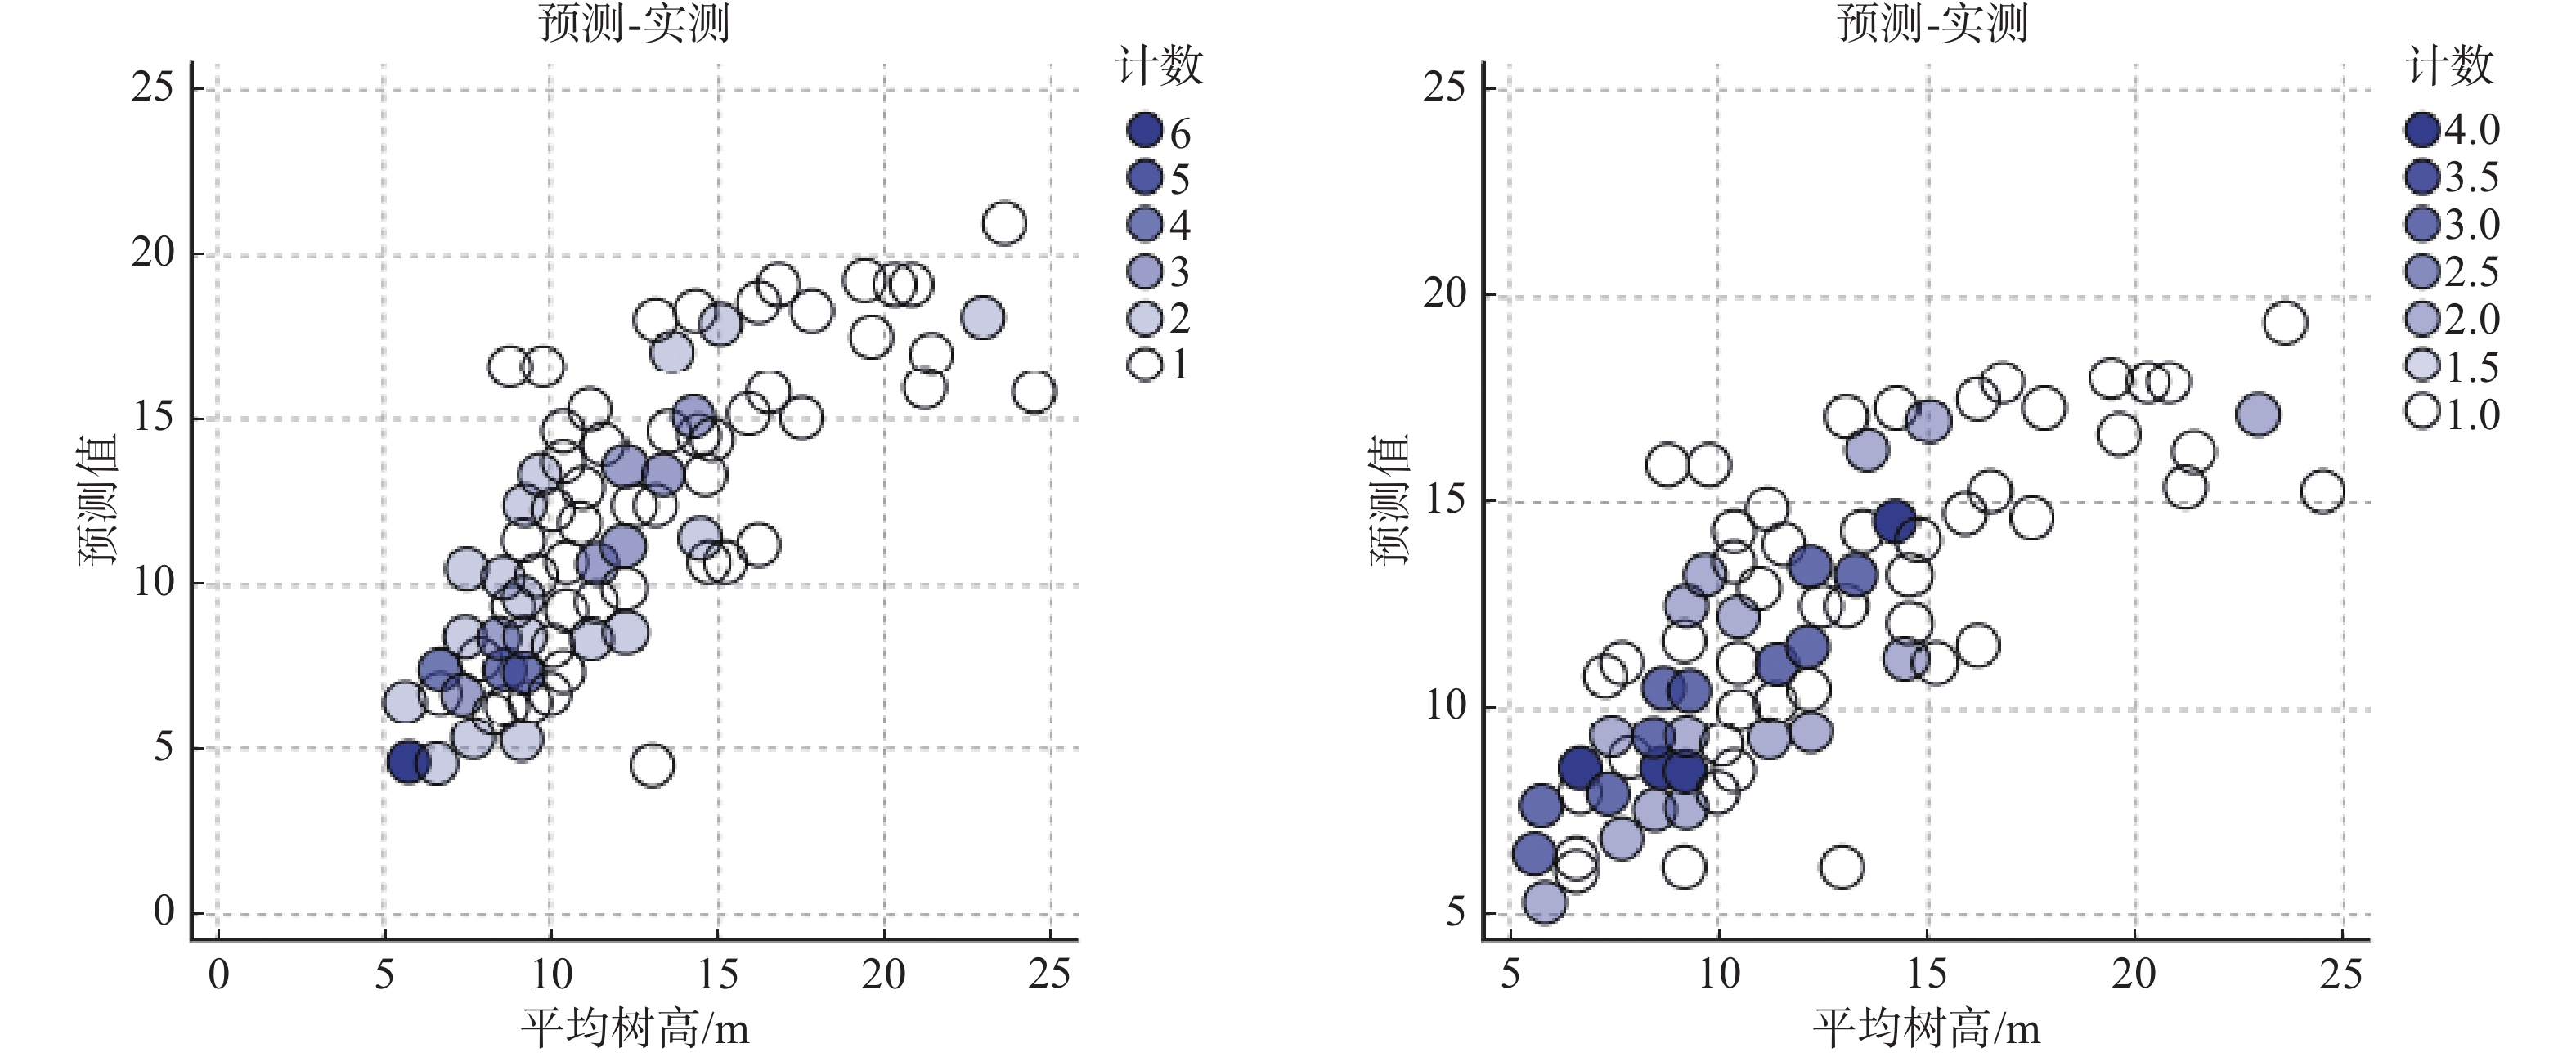
基础模型与最优混合模型预测—实测散点图详见图2,从图2可以明显看出,最优混合模型考虑了截距
$ {\beta 2}^{\text{'}} $ 作为混合参数来参与模型拟合。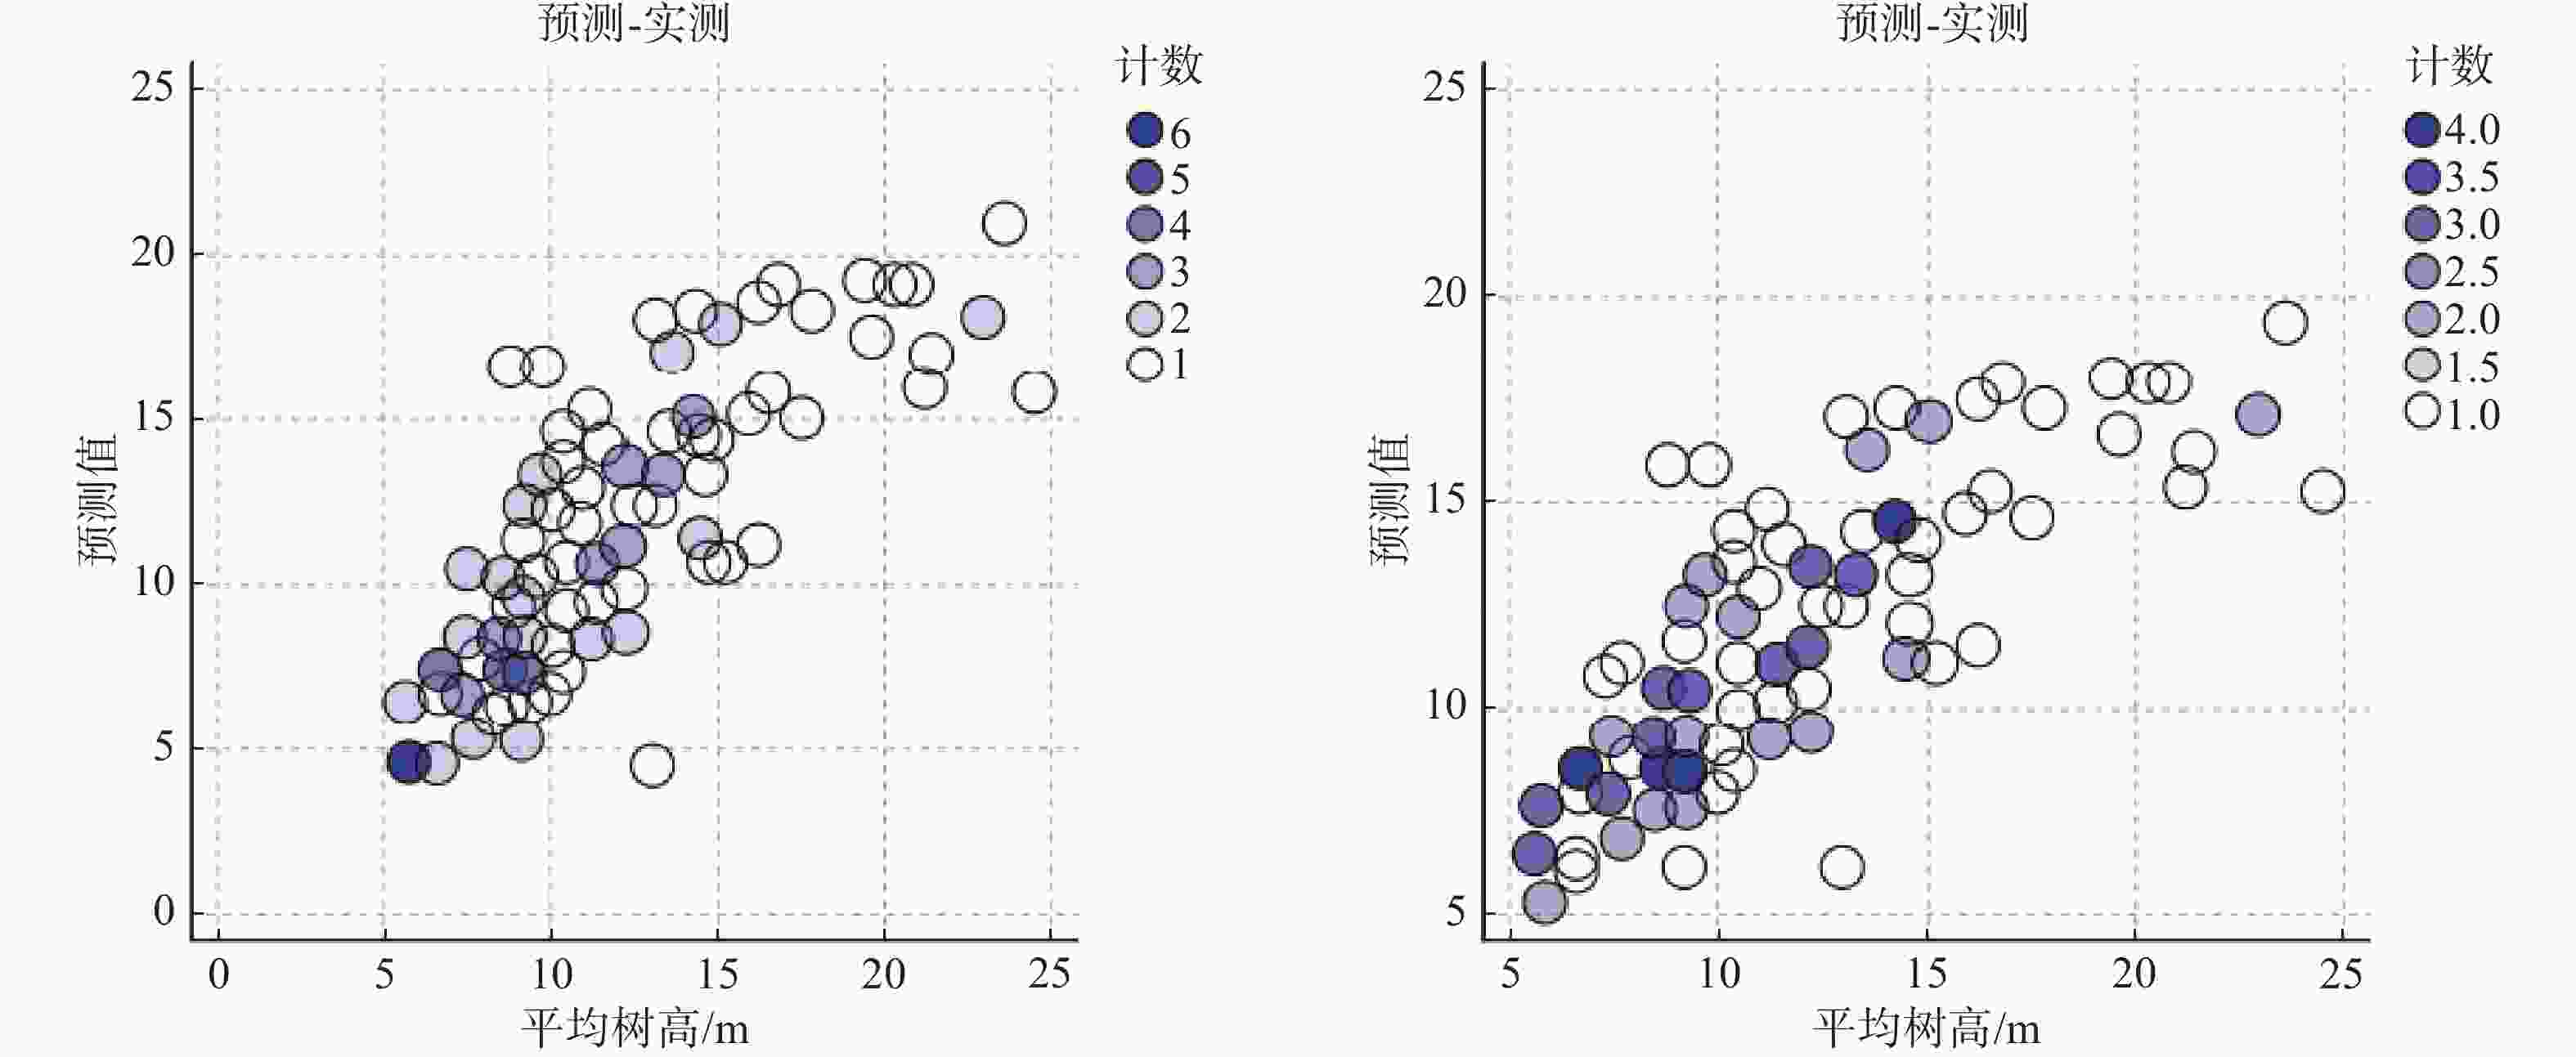
Figure 2. Basic model (left) and optimal mixed model (right) prediction - measured scatter plot
-
李明华等使用模型法来研究上海市主要造林树种胸径与树高之间的变化关系,各模型的拟合效果均较好[23]。刘浩等以18块落叶松人工林为研究对象,使用6个方程来拟合树高—胸径模型,各方程的
$ {R}^{2} $ 均在0.81以上[24]。多位学者的研究均表明树高与胸径的相关关系极显著,与本次研究结果一致。许多学者研究树高—胸径模型均得出相同的结论:幂函数模型的拟合效果最好[25-26],本次研究也是幂函数模型的拟合精度最高,其中,华山松林分的幂函数模型拟合精度最高,达到了0.997。栎类对数函数模型的拟合精度最低,仅有0.879。华山松样地为人工,海拔跨度353 m,在研究的5个树种中海拔跨度最小,郁闭度跨度也较小,而栎类林分起源为天然,海拔跨度最大,达到1379 m,这些环境因素应该对模型拟合精度产生了一定的影响。刘春云等学者研究中国落叶松林胸径与树高的相关关系时发现胸径与树高受温度的影响极显著,不同的环境因子均能对树高胸径的相关关系产生影响[27]。混合模型应用于木材碳密度变化时表现出更好适用性[28],混合效应模型在研究林分平均高与林分优势木平均高的相关性上不仅反映了其整体变化趋势,还能体现立地条件之间的差异。模型拟合效果更好[29],多数关于树高与胸径之间的相关关系研究都是针对单一树种,此次研究考虑林分优势木平均高与平均胸径的相关关系时,将不同树种作为一个整体,考虑树种之间的差异作为随机效应参与模型拟合,混合模型的
$ \mathrm{A}\mathrm{I}\mathrm{C} $ 、$ \mathrm{B}\mathrm{I}\mathrm{C} $ 的表现更优,模型拟合效果更好,说明在类似林分条件下混合模型不仅可以反映林分优势木平均高在平均胸径上的整体变化趋势,还能体现不同树种对其产生的影响。
Research on average height and average DBH model of dominant trees in forest stands based on Mixed Effect Model
doi: 10.12172/202303240001
- Received Date: 2023-03-24
- Available Online: 2023-10-24
- Publish Date: 2024-02-25
-
Key words:
- dominant tree /
- average height /
- average DBH /
- Mixed Effect Model
Abstract: The Mixed Effect Model is gradually being applied in the forestry field, which can not only describe the overall change law of data, but also reflect the changes between data, making the estimation results more accurate. Calculating tree height by diameter at breast height provides convenience for forestry investigation to a certain extent. Taking 123 sample plots in Huili City as the research object, the mixed effect model of average height and average DBH of dominant trees in forest stands was constructed, and the correlation between average height and average diameter of dominant trees in forest stands was analyzed. The research results showed that: (1) The correlation between average height and average DBH of dominant trees in forest stands was extremely significant. (2) The fitting effect of the power function model was the best both among individual trees on the whole. (3) The Mixed Effect Model could not only reflect the overall change trend of the average height of dominant trees in forest stands on the average DBH, but also reflect the impact of different tree species. The performance of AIC and BIC was better, and the model fitting effect was better.


 DownLoad: